Question
Question: The diagram shows the graph of pressure vs density for given mass of an ideal gas at two temperature...
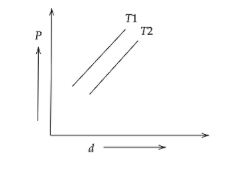
The diagram shows the graph of pressure vs density for given mass of an ideal gas at two temperatures T1 and T2
A) T1>T2
B) T1=T2
C) T1<T2
D) Any of the three are possible
Solution
The internal energy of the gas is measured by multiplying the total number of gas molecules with the average kinetic energy of each molecule. This means that the density is inversely proportional to temperature. To address this statement, the basic laws are used for unit volume.
Useful formula:
Ideal Gas Law in term of density
PM=dRT
Where,
d - density of gas
P - Pressure
R- Gas Constant
T-Temperature
M- Molar Mass
Complete step by step process:
Given by,
An ideal gas at two temperatures T1 and T2
As we know the ideal gas formula,
PM=dRT
The above diagram,
The slope of the straight line T1 is greater than that of T2.
pressure of a given gas is inversely proportional to its volume provided the temperature remains constant
PV=nRT
Therefore,
P=wRT/MV
Rearranging the above equation,
P=dRT/M
The rms speed of the gas is given by 3Pp.
It means gas rms of T1 molecules are higher than T2 molecules.
Therefore, Pαd−T
So, T1>T2.
Hence, option A is the correct answer.
Note: The number of molecules in a gas is very high and the average separation between them is greater than the size of the gas molecules. The molecules of different gases are different. The measurement of heat is temperature. The molecules of different gases are different. Density is the indicator of how tightly an object is packaged or the ratio of the object's mass to its length.