Question
Question: The diagram shows the displacement-time graph for a particle moving in a straight line. The average ...
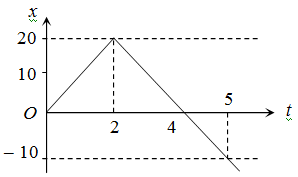
The diagram shows the displacement-time graph for a particle moving in a straight line. The average velocity for the interval t = 0, t = 5 is
A
0
B
6 ms–1
C
– 2 ms–1
D
2 ms–1
Answer
– 2 ms–1
Explanation
Solution
Average velocity = TotaltimeTotaldisplacement
= 5(20)+(−20)+(−10) = –2 m/s