Question
Question: The diagram given shows how the net interaction force (conservative) between two particles \(A\) and...
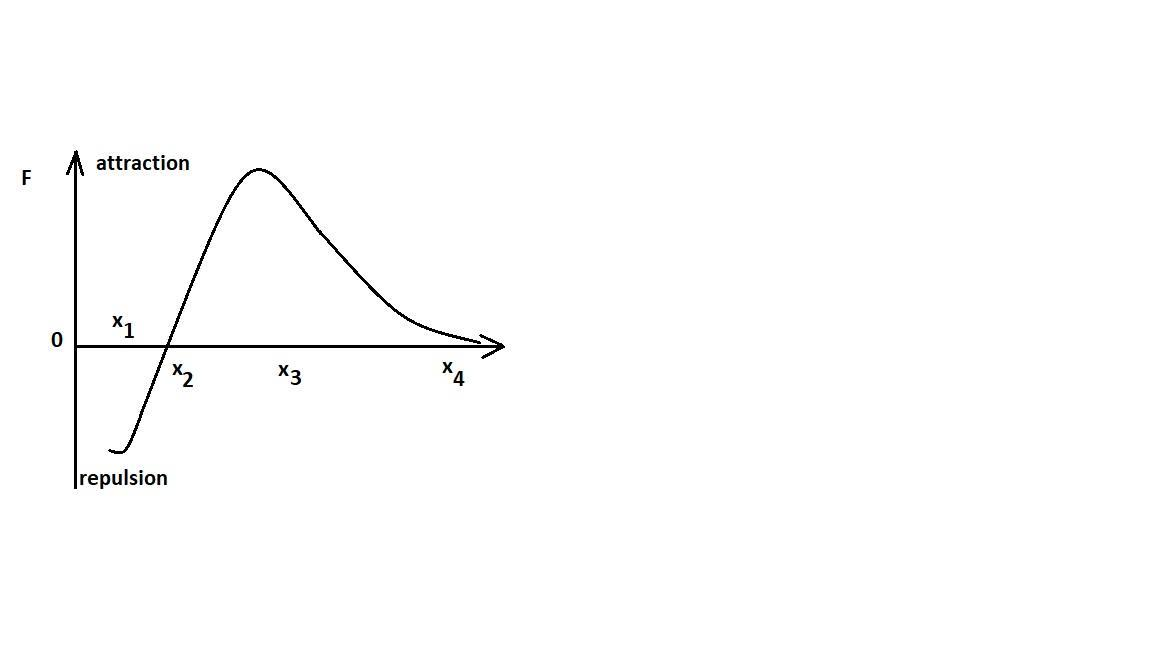
The diagram given shows how the net interaction force (conservative) between two particles A and B is related to the distance between them varies from x1 to x2 . Then
(A) Potential energy of the system increases from x1 to x2
(B) Potential energy of the system increases from x2 to x3
(C) Potential energy of the system increases from x3 to x4
(D) KE increases from x1 to x2 and decreases from x2 to x3
Solution
We will pull in the concept of potential energy to be the work done stored by the system. We will then try out the relationships and then finally find the correct option.
Formulae Used F=−dxdU
Step By Step Solution
Firstly,
F=−dxdU
Thus, we can say,
dU=−Fdx
Now,
Clearly,
When F is positive, dU is negative and when F is negative, dU is positive.
For the region from x1 to x2 , F is negative as we can see from the graph itself.
Thus, dU is positive.
Which means potential energy increases from x1 to x2.
Now,
Again for the region x2 to x3, F is positive.
Thus, we can say dU is negative.
Which means that potential energy decreases from x2 to x3.
Now,
For the region x3 to x4 , the force keeps on decreasing making it negative.
Thus,
F is negative here.
Thus,
dU is positive.
Which means potential energy increases here.
Thus, taking all these observations into consideration, we can say (A) is the correct option.
Note: When dU is positive, the potential energy increases because dU refers to the change in the potential energy. When its value is positive, the final potential energy value is greater than the initial potential energy value. Thus making its overall value to be positive. The same analogy goes true when dU is negative.