Question
Question: the diagram below shows the ln(P) vs 1/T for four substances . The Clausius Claperyon equation descr...
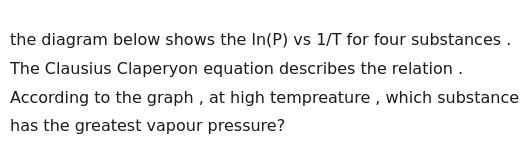
the diagram below shows the ln(P) vs 1/T for four substances . The Clausius Claperyon equation describes the relation . According to the graph , at high tempreature , which substance has the greatest vapour pressure?
D
Solution
The relationship between vapour pressure (P) and temperature (T) is described by the Clausius-Clapeyron equation:
ln(P)=−RΔHvapT1+C
where ΔHvap is the enthalpy of vaporization, R is the ideal gas constant, and C is a constant related to the entropy of vaporization.
The given graph plots ln(P) on the y-axis and 1/T on the x-axis. This is a linear relationship of the form y=mx+c, where y=ln(P), x=1/T, the slope m=−RΔHvap, and the y-intercept c=C.
The question asks which substance has the greatest vapour pressure at high temperature.
High temperature corresponds to a small value of 1/T. On the graph, this corresponds to the left side of the x-axis.
To find the substance with the greatest vapour pressure at high temperature, we need to look at the left side of the graph and identify which substance has the highest value of ln(P). Since ln(P) is plotted on the y-axis, the substance with the highest line on the left side of the graph has the greatest ln(P), and thus the greatest vapour pressure (P).
Looking at the graph, on the left side (representing high temperature, small 1/T), the lines for the four substances A, B, C, and D are arranged from bottom to top as A, B, C, and D. Substance D is the topmost line among the four.
This means that for any given high temperature (small 1/T value) within the range shown on the graph, the value of ln(P) for Substance D is greater than the values for substances C, B, and A.
ln(P)D>ln(P)C>ln(P)B>ln(P)A at high temperature.
Since the natural logarithm function is monotonically increasing, a higher value of ln(P) corresponds to a higher value of P. Therefore, the vapour pressure of Substance D is the greatest at high temperature.
The slope of the line is m=−RΔHvap. The slopes are negative. The magnitude of the slope is ∣RΔHvap∣=RΔHvap.
From the graph, the slopes are ordered as follows (from steepest negative to least steep negative): A, B, C, D.
Magnitude of slopes: ∣mA∣>∣mB∣>∣mC∣>∣mD∣.
Since m=−RΔHvap and R is positive, ΔHvap=−mR.
So, ΔHvap,A>ΔHvap,B>ΔHvap,C>ΔHvap,D.
Substance D has the smallest enthalpy of vaporization. Substances with smaller enthalpies of vaporization have weaker intermolecular forces and tend to have higher vapour pressures at a given temperature, which is consistent with our finding from the graph.
The y-intercept is C. The y-intercept represents ln(P) as 1/T→0 (T→∞). From the graph, the y-intercepts are ordered as CD>CC>CB>CA.
At high temperature (small 1/T), the term −RΔHvapT1 becomes smaller in magnitude. The value of ln(P) approaches the y-intercept C. Since CD is the largest, ln(P)D is the largest at very high temperatures.
Based on the graph, Substance D has the highest ln(P) value in the high-temperature region (left side of the graph). Therefore, Substance D has the greatest vapour pressure at high temperature.