Question
Question: The data plotted on a graph of distance on the y-axis vs. time on the x-axis yields a linear graph. ...
The data plotted on a graph of distance on the y-axis vs. time on the x-axis yields a linear graph. Identify which of the following options best describes the slope of the graph.
(A) ΔtΔd
(B) (Δd)(Δt)
(C) ΔdΔt
(D) (Δd)+(Δt)
(E) (Δd)−(Δt)
Solution
Hint
We need to draw a linear graph of distance on the y axis and time on the axis and take two points on it. Then we need to calculate the slope using its basic definition.
Formula Used: The formula used to solve this question is
tanθ=BaseHeight
Complete step by step answer
As given in the question, the graph plotted between distance, dand time, t is a linear graph. So we draw the graph according to the question.
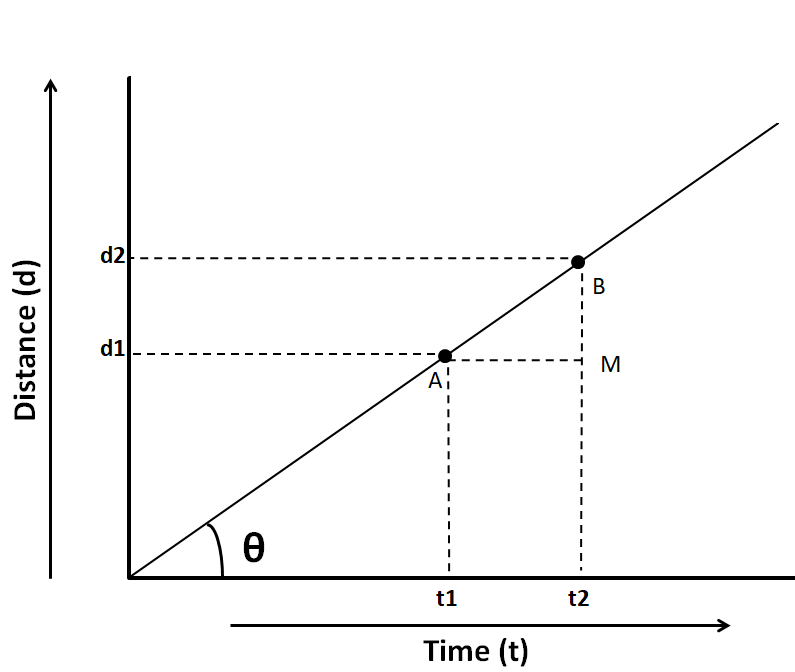
Let the graph make an angle of θ with the x-axis. As the graph is linear, so its slope is constant at each point on the graph. For calculating the slope, we take two points, A and B on the graph and calculate the slope from their corresponding coordinates. According to the definition, slope of a line is equal to the tangent of the angle made by that line with the x-axis, i.e.
Slope, m=tanθ
As tanθ=BaseHeight
∴m=BaseHeight=AMBM
From the triangle AMB in the figure above,
BM=d2−d1, AM = t2−t1
Substituting these in the above equation, we get
m=t2−t1d2−d1
∴m=ΔtΔd
So, we have a slope equal toΔtΔd.
Hence, the correct answer is option A, ΔtΔd/
Note
The graph in this question is plotted between distance and time. We know that the slope of such a graph indicates the velocity. So the unit of slope will be the same as the unit of velocity, i.e. m/s. From the options given, only A (ΔtΔd) has the unit of velocity. Thus, these types of questions can also be attempted through the knowledge of units and dimensions.