Question
Question: The current I and voltage V graphs for a given metallic wire of two different temperatures \(T_1\) a...
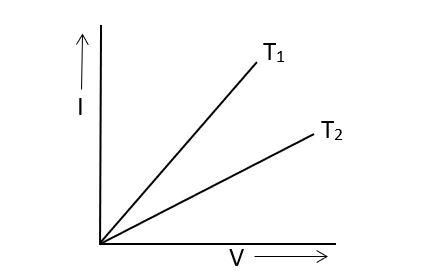
The current I and voltage V graphs for a given metallic wire of two different temperatures T1 and T2 which has been shown in the following figure. It is concluded that:
Solution
The inverse of the slope of the given graph gives us the resistance of a material at that point. We can thus understand the dependence of temperature on molecular level. As the two temperatures are different, their resistances will also be different.
Complete step by step answer:
In the given graph, the x-axis represents the voltage (V) and the y-axis represents the current (I). The graph has been plotted for a metallic wire at two different temperatures. If we take the inverse of the slope of the graph at any point, we will get the resistance of the wire.
According to Ohm’s law, we have V=IR, where V is the voltage, I is the current and R is the resistance. Upon rearranging the equation, we get R=IV⟹R1=VI, which is the slope of the graph given.
From the graph, we can see that the slope of the graph at temperature T1 is greater than that at temperature T2. Now, we know that the resistivity of a metal increases, with increase in temperature and hence it’s resistance also increases. Since the material of the wire is the same, the resistance will be less at temperature T1 than at T2.
Hence, we can say that T2>T1.
Note:
The movement or say bouncing of electrons and their frequency of collisions increases with the increase of temperature. The resistivity increases with temperature rise in case of metals. While in the case of insulators, the resistivity decreases with increase in temperature.