Question
Question: The correct curve between voltage gain (\({A_V}\)) and load resistance (\({R_L}\)) is : \({A_V}\) ...
The correct curve between voltage gain (AV) and load resistance (RL) is :
AV is on Y axis whereas RL is on X axis for all the graphs
A. 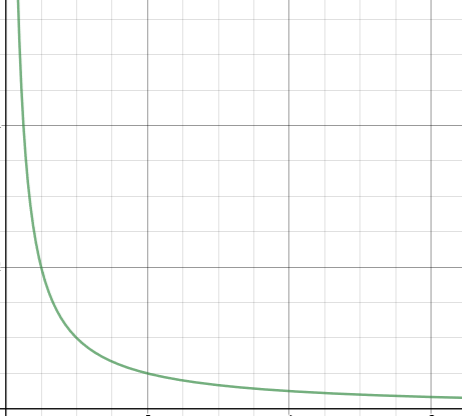
B. 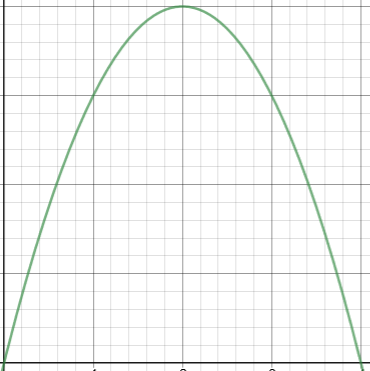
C. 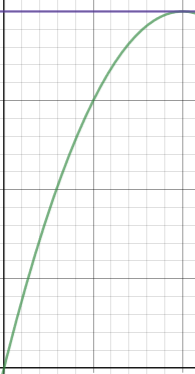
D. 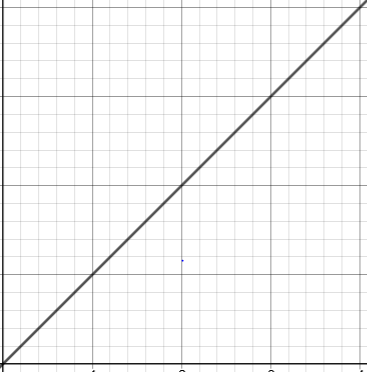
Solution
If we combine two extrinsic semiconductors we get diodes. Extrinsic semiconductor in which electrons are excess are called n-type semiconductor whereas extrinsic semiconductor in which holes are excess are called p-type semiconductor. Now if we combine two diodes we get a transistor. It can be a p-n-p transistor or n-p-n transistor. That transistor has an emitter base and collector and can be used as switches, amplifiers and as many other devices.
Formula used: AV=1+RLrμ
Complete step by step answer:
The characteristics of emitter, base and collector will be different. Emitter is highly doped while the collector and base are lightly doped. The width of the base is very less. Moreover emitter-base junction is always forward biased whereas base-collector junction is always reverse biased. Forward biased in the sense diode provides very low resistance and reverse biased in the sense diode provides huge resistance.
The voltage which we applied will be lesser than the output voltage. That means there will be some voltage gain. That voltage gain depends upon the load resistance and the input resistance.
We have got the formula to find out the voltage gain and that formula is AV=1+RLrμ
Where μ is constant and r is input resistance and RL is load resistance
It's clearly evident from the formula that if load resistance is very small then denominator is very big and then load voltage gain will be small and if load resistance keeps on increasing the voltage gain increases and reaches constant value finally.
So, the correct answer is “Option C”.
Note: The voltage gain which we have should have no units because technically it is the ratio of output voltage to the input voltage. For this kind of question first we should substitute X reading as zero then check the value of Y then substitute Y value as zero and find out the value of X. Then we can confirm the graph which suits the answers we had got.