Question
Question: The bar graph represents the heights (in cm) of \(50\) students of class XI of a particular school. ...
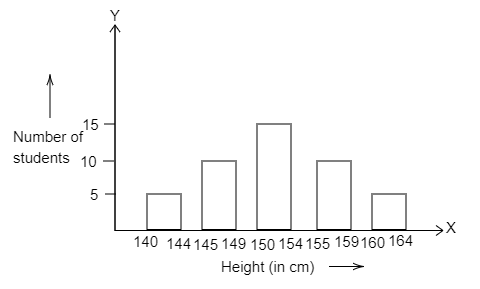
The bar graph represents the heights (in cm) of 50 students of class XI of a particular school. Study the graph and answer the following question:
State whether true or false:
Maximum height (in cm) of a student in the class is 17.
Solution
Observe that the given bar graph is drawn as number students against the heights of the students measured in cm. Go through the measures for each data carefully. Interpret the data correctly. First see what each bar is describing mathematically and then based on that answer the question using the information gathered.
Complete step by step solution:
On the y-axis we have a number of students. We observe that it ranges from 0 to 20. Therefore for a particular height there are maximum 20 students whose height lies in that range.
On the x -axis we have the height of the students measured in centimetre. The minimum height is 140 cm and maximum are 165. Therefore, all the height value lies in this interval.
Now let us see what each bar in the bar graph represents.
The first bar starts at the x value between 140−144 and it corresponds to the y value of 5. This means that there are a total 5 students with height in the range of 140−144 cm.
The second bar starts at the x value between 145−149 and it corresponds to the y value of 10. This means that there are total 10 students with height in the range of 145−149 cm.
The third bar starts at the x value between 150−154 and it corresponds to the y value of 17. This means that there are total 17 students with height in the range of 150−154 cm.
The fourth bar starts at the x value between 155−159 and it corresponds to the y value of 7. This means that there are a total 7 students with height in the range of 155−159 cm.
The fifth bar starts at the x value between 160−164 and it corresponds to the y value of 5. This means that there are a total 5 students with height in the range of 140−144 cm.
Therefore, we can say that the maximum number of students with height in the range of 150−154 and the number is 17 but it doesn’t mean that the maximum height (in cm) of a student in the class is 17 .
Thus, the correct answer is false.
Note: Here the important thing to note is that the graph cannot say anything about the height of an individual student so we cannot really determine the height of the particular student. Thus, it was clear that the given statement is false when it talks about the height of the individual student. But to be sure we need to study in detail.