Question
Question: The area under the acceleration-time graph gives: A.) Distance travelled B.) Change in direction...
The area under the acceleration-time graph gives:
A.) Distance travelled
B.) Change in direction
C.) Force acting
D.) Change in velocity
Solution
Hint: Try to understand the concept of graphs between two physical quantities. Draw an acceleration-time graph. Try to find the area of the graph with the help of physical notations. Then we can find our answer.
Complete step by step answer:
An acceleration-time graph is represented as the acceleration on the y-axis or the vertical axis and time in the x-axis or the horizontal axis. The value of the graph at a particular time will give us the acceleration of the object at that point of time.
Slope of an acceleration-time graph is known as a jerk. It gives us the rate of change of acceleration.
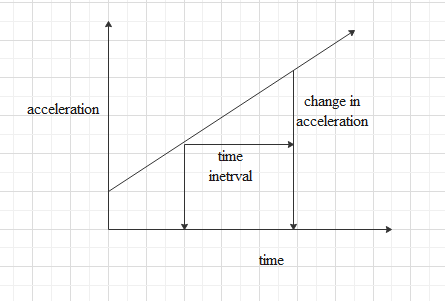
We can find the area under the acceleration-time graph for a certain time interval.
Area under the graph can be defined as, area =Δa×Δt
Where, Δt is the time interval and Δa the change in acceleration in that time interval.
Now we can find acceleration as,
Δa=ΔtΔv
So, by multiplying both sides of equation by Δt , we can write,
Δa×Δt=Δv
So, the area under the acceleration-time graph can be given as,
area =Δa×Δt=Δv
Which is the rate of change of velocity.
So, the area under any acceleration time graph at a certain time interval will give us the rate of change of velocity.
The correct option is (a).
Note: For a constant acceleration we will get a linear graph parallel to the time axis. If we have a uniformly increasing acceleration, we will get a straight line with a slope. For non-uniform acceleration we won’t get a straight-line graph.