Question
Question: The adjoining diagram shows the spectral energy density distribution \({E_\lambda }\) of black body ...
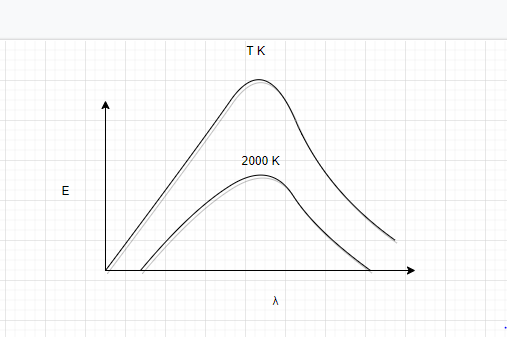
The adjoining diagram shows the spectral energy density distribution Eλ of black body at two different temperatures. If the area under the curves are in the ratio 16:1, the value of temperature T is
A. 32000K
B. 16000K
C. 8000K
D. 4000K
Solution
For a blackbody the relation between emissive power and temperature is given by Stefan’s law which states that emissive power is directly proportional to the fourth power of temperature.
E∝T4
Where, E is the emissive power and T is the temperature.
The area under the graph between energy density Eλ and wavelength λ gives the emissive power.
Complete step by step answer:
For a blackbody the relation between emissive power and temperature is given by Stefan’s law which states that emissive power is directly proportional to the fourth power of temperature.
E∝T4
Where, E is the emissive power and T is the temperature
The area under the graph between energy density Eλ and wavelength λ gives the emissive power.
Let the area under the curve at TK be A1.Then
A1∝T4 …… (1)
That is,A1=σT4
Let area under the curve at 2000K be A2 ;then,
A2∝(2000)4 …….. (2)
That is,
A2=σ(2000)4
Divide equation (1) by (2)
A2A1=(2000)4T4 ……. (3)
Ratio of area is given as 16:1
Substituting this in equation (3), we get
116=20004T4 (2000T)=(16)41 T=2000×2 =4000K
So, the correct answer is option D.
Note: A black body is a body that absorbs all the radiation falling on it and it has emissivity equal to 1. It is important in this problem that we consider the power of the temperature and just don’t solve it assuming a linear relationship.