Question
Question: The acceleration-time graph of a body is shown below– <img src="https://cdn.pureessence.tech/canvas...
The acceleration-time graph of a body is shown below–

The most probable velocity-time graph of the body is
A
B
C
D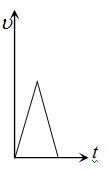
Answer
Explanation
Solution
From given a−t graph acceleration is increasing at constant rate
∴ dtda=k (constant) ⇒ a=kt (by integration)
⇒ dtdv=kt ⇒ dv=ktdt
⇒ ∫dv=k∫tdt ⇒ v=2kt2
i.e., v is dependent on time parabolically and parabola is symmetric about v-axis. and suddenly acceleration becomes zero. i.e. velocity becomes constant.
Hence (3) is most probable graph.