Question
Question: The acceleration of a train between two stations is shown in the figure. The maximum speed of the tr...
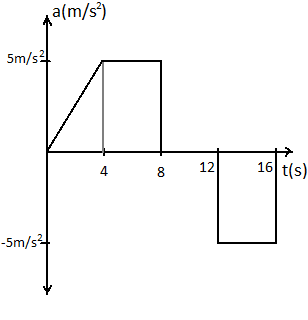
The acceleration of a train between two stations is shown in the figure. The maximum speed of the train is:
A) 60ms−1
B) 30ms−1
C) 120ms−1
D) 90ms−1
Solution
Define acceleration and try to recall the mathematical expression of acceleration. From the graph and from the relation between velocity and acceleration we can easily estimate the maximum speed the train can reach.
Complete step by step solution:
Let’s have some nostalgia and revisit our classes of kinematics. Our physics teacher was yelling that acceleration is the rate of change of velocity.
For a small change in velocity dv over a time dt acceleration of a body can be represented mathematically as,
a=dtdv ……….. (1)
Further simplifying,
⇒dv=a×dt
For the maximum velocity, we can integrate both sides of the above equation.
Taking integration both sides, we get
⇒v=∫adt ………. (2)
This is the expression for velocity in terms of acceleration.
Now we know that integrating a function/ curve, we get the area under that function/ curve. Thus from equation (2), we can conclude that the area under the acceleration-time graph is defined as the velocity of the train/ moving object.
Now from the diagram given in the question, we can see that after 12s mark, the acceleration of the train is negative, so in order to calculate the maximum velocity, we can take the area under the graph before the 12s mark.
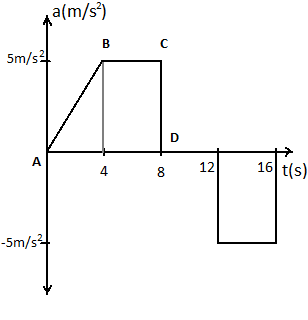
From the above diagram the area of the section ABCD gives us the maximum velocity.
Area of ABCD is the sum of area of right angled △ABE and the rectangle BCDE.
Area of △ABE is 21×4×5=10
Area of rectangle BCDE is 5×4=20
Thus the maximum velocity of the train would be 10+20=30ms−1
So the correct answer is option B.
Note: Using this technique we can solve problems where we are provided with a graph in simple kinematics, for example, in a velocity time graph, the area under the graph represents the displacement of the moving body. Because the rate of change of displacement is defined as velocity.