Question
Question: The a-t graph for a particle moving along a straight line is shown in the figure. If the initial vel...
The a-t graph for a particle moving along a straight line is shown in the figure. If the initial velocity of the particle is 2 m/s then what is the velocity of the particle (in m/s) at t = 4 seconds?
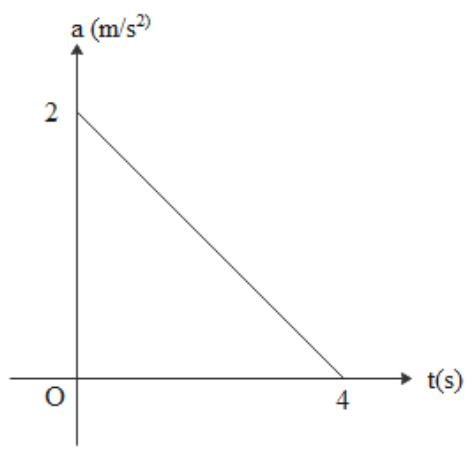
A. 4
B. 6
C. 8
D. 10
Solution
An a-t graph is a plot between acceleration and time. The area under the acceleration-time graph curve gives the change in the velocity of the object.
Alternatively said, the area under the acceleration graph for a specific time interval gives the change in velocity during that time interval.
Formula used: Acceleration of a body, a=tvf−vi
Complete step-by-step solution:
The area under the acceleration graph for a specific time interval gives the change in velocity during that time interval.
Acceleration of a body is defined as a change in its velocity per unit time. In other words, acceleration is the rate of change of velocity.
The area under the curve in the acceleration-time graph gives us a change in velocity.
Initial velocity of the particle is vi=2m/s.
The area under the curve is the area of the triangle ABC as shown in the figure.
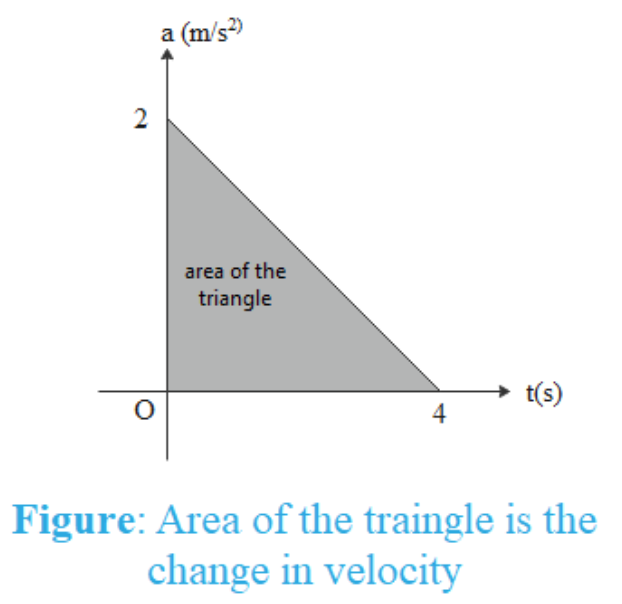
The area of a triangle is the product of its base length and height of the triangle as measured from the base.
Area under the curve = 21×(base)×(height)=21×4×2=4m/s
This is the change in velocity of the object. Therefore,
vf−vi=vf−2m/s=4m/s
⇒vf=2m/s+4m/s=6m/s
Hence, option B is correct.
Additional information: Area under the curve in velocity-time graph denotes displacement. Velocity is the rate of change of position. It is also a vector quantity.
Note: Acceleration of a body is defined as the change in its velocity per unit time. It is a vector quantity. We did not use vectors in this question because the motion is in a straight line. The area under the acceleration graph for a specific time interval gives the change in velocity during that time interval.