Question
Question: Table shows different types of clothing in certain clothing shops. Construct a pie chart from the gi...
Table shows different types of clothing in certain clothing shops. Construct a pie chart from the given data-
| Type of clothing | Number of clothing |
|---|---|
| Saree | 650 |
| Dress | 740 |
| Gents wear | 560 |
| Kids wear | 450 |
What part of the clothing is Kids wearing?
Solution
First, from the data given in the question, we have to find the total number of clothing of different types that sum up all the numbers of clothing of different types. Then, we prepare a table of columns: type of clothing , number of clothing , part of type contributing the total clothing and angle in pie chart for each type of clothing. To draw the pie chart, the angle of each type is calculated by multiplying its part of type contributing the total clothing with 360∘. Now we can draw the pie chart using the table .
Complete step-by-step solution:
Total number of clothing materials=
650+740+560+450
=1390+560+450
=1950+450
=2400
| Type of clothing | Number of clothing | Part of type contributing the total clothing | Angle in pie chart for each type of clothing |
|---|---|---|---|
| Saree | 650 | 2400650=4813 | 4813×360∘=97.5∘ |
| Dress | 740 | 2400740=12037 | 12037×360∘=111∘ |
| Gents wear | 560 | 2400560=307 | 307×360∘=84∘ |
| Kids wear | 450 | 2400450=163 | 163×360∘=67.5∘ |
The part of clothing kids wear =163.
Pie chart of above information :
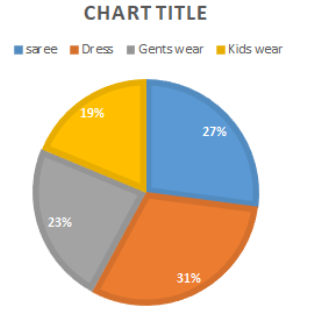
Note: Here we have provided all the information in the table . This form of assembling of data helps us to analyze data in a simple way and also helps in easy preparation of pie charts.
Angle in pie chart for saree=97.5degrees.
Angle in pie chart for Dress= 111 degrees
Angle in pie chart for Gentswear =84 degrees
Angle in pie chart for Kidswear=67.5 degrees