Question
Quantitative Ability and Data Interpretation Question on Pie Charts
| Study the pie chart and table and answer the questionsStore | Respective ratio of number of linen kurtis to cotton kurtis sold |
|---|---|
| A | 7:5 |
| B | 5:6 |
| C | 3:2 |
| D | 5:3 |
| E | 4:3 |
| F | 7:3 |
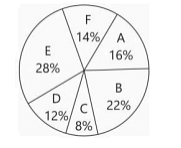 Distribution of total no. of Kurtis (cotton and linen) sold by six different stores in 2016,where total kurtis sold are 84,000 Distribution of total no. of Kurtis (cotton and linen) sold by six different stores in 2016,where total kurtis sold are 84,000 | |
| Number of kurtis (linen and cotton) sold by store D is what percent more than the number of linen kurtis sold by store B? |
A
16%
B
20%
C
24%
D
18%
Answer
20%
Explanation
Solution
The correct option is (B): 20%.