Question
Question: Study the following charts carefully and answer the question given. Cars of which colours are \(20...
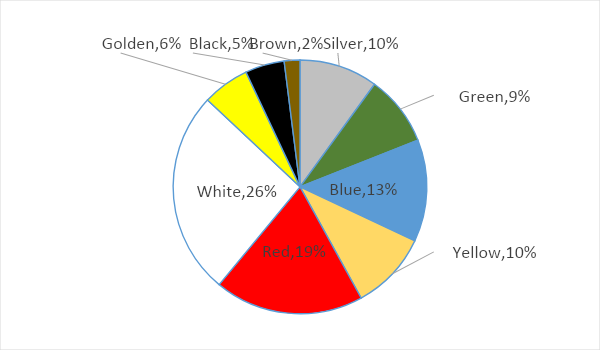
Study the following charts carefully and answer the question given.
Cars of which colours are 20% less popular than white coloured cars?
Solution
We have to find the colour of the car which is 20% less popular than the white coloured car. The given chart is called a pie chart, the relative strength of each component is shown against a measure of the share of the pie a component occupies, so we can see that the pie’s white colour occupies the 26% percent of the pie and other colours relative strength is also given in the chart. We will first find the value 20% lesser than 26% of white then see which colour is nearest to that value and those colours will be our answers. Note that the question asks ‘colours’ not ‘colour’.
Complete answer:
The white colour car occupies 26% of the pie the question asks to find the cars which are 20% less popular than this colour.
The 20% of white’s share will be,
⇒10020×26
⇒5.2%
So the 20% less popular colours should be
⇒26−5.2
⇒20.8%
We can see all the other cars in the pie chart given have values less than the 20.8% and thus we can say all the colours of the cars are 20% less popular than the white coloured car.
Note:
The chart given is a pie chart. The whole angle of a pie chart is equal to the complete angle of a circle which is 360∘. The central angle of any component is the angle of the pie occupied by a component. The central angle (C.A. ) can be calculated using the formula:
C.A.=100P×360,
Where P is the percentage of pie occupied by a component.