Question
Question: Starting from rest a car moves with uniform acceleration and attains a velocity of \(90{\text{km/h}}...
Starting from rest a car moves with uniform acceleration and attains a velocity of 90km/h in 25s. It then moves with uniform speed for 30s and is then brought to rest in 20s under uniform retardation. Find total distance travelled using velocity - time graph.
Solution
In this question, the concept of the velocity time graph will be used, that is the area under the curve of the graph represents the total distance travelled. Plot the velocity-time graph according to the question given. Find the area of the graph which will give the result for total distance travelled using velocity - time graph.
Complete step by step answer:
Firstly, to solve this question, we have to convert the velocity given for the car in m/sformat.
So,
⇒90km/h=90×3601000m/s=25m/s
Now, we plot the velocity-time graph (or the v-t graph) for the question, as shown below: -
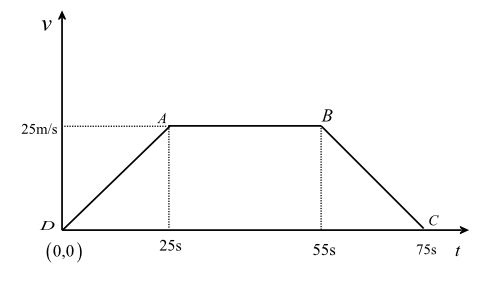
The above diagram represents the velocity time graph (v-t graph) for the question.
As we have given in the question, velocity of the car is plotted in the y-axis and time is plotted in the x -axis.
In case of x -axis (that is for plotting time): The car moves with uniform acceleration and attains a velocity of 25m/s in25 s, so the first point is given as 25 s. It then moves with uniform speed for30s, so the next point is given as 55s (25+30=55s). Then the car is brought to rest in 20s, so the last point is given as 75s (25+30+20=75s).
Now, according to the formula for displacement, we have to calculate the Area under the velocity-time graph. (As Displacement= Area under velocity-time graph)
So we can clearly see in the figure that the figure forming in the velocity-time graph is a Trapezoid.
So,
⇒Area of Trapezoid=21×(Sum of Parallel Sides)×(Distance between them)
Here, Parallel sides (according to the v-t graph) are ABand CD. And the distance between them is 25m/s.
⇒Area of Trapezoid=21×(AB+CD)×25
Now, we substitute the given values as,
⇒Area of Trapezoid=21×(30+75)×25
After simplification we get,
⇒Area of Trapezoid=1312.5m
Hence, the total distance travelled using velocity-time graph is 1312.5m.
Note: Mistakes occur while plotting the velocity-time graph. In x-axis, time plotted should be taken cautiously as the timestamps are summed up continuously and plotted. Conversion of units is done for the ease of calculation.