Question
Question: Solve the inequality \(x + y < 5\) graphically in a two-dimensional plane....
Solve the inequality x+y<5 graphically in a two-dimensional plane.
Solution
In order to solve any inequality graphically, first we have to plot the graph of the equation corresponding to the inequality and then determine the region the given inequality satisfies. The solution to any inequality is the region that consists of all the points that would satisfy the given inequality. Generally, we perform the origin test to find the region that is satisfied by the inequality.
Complete step-by-step answer:
It is given that we need to solve the inequality x+y<5 graphically in a two-dimensional plane.
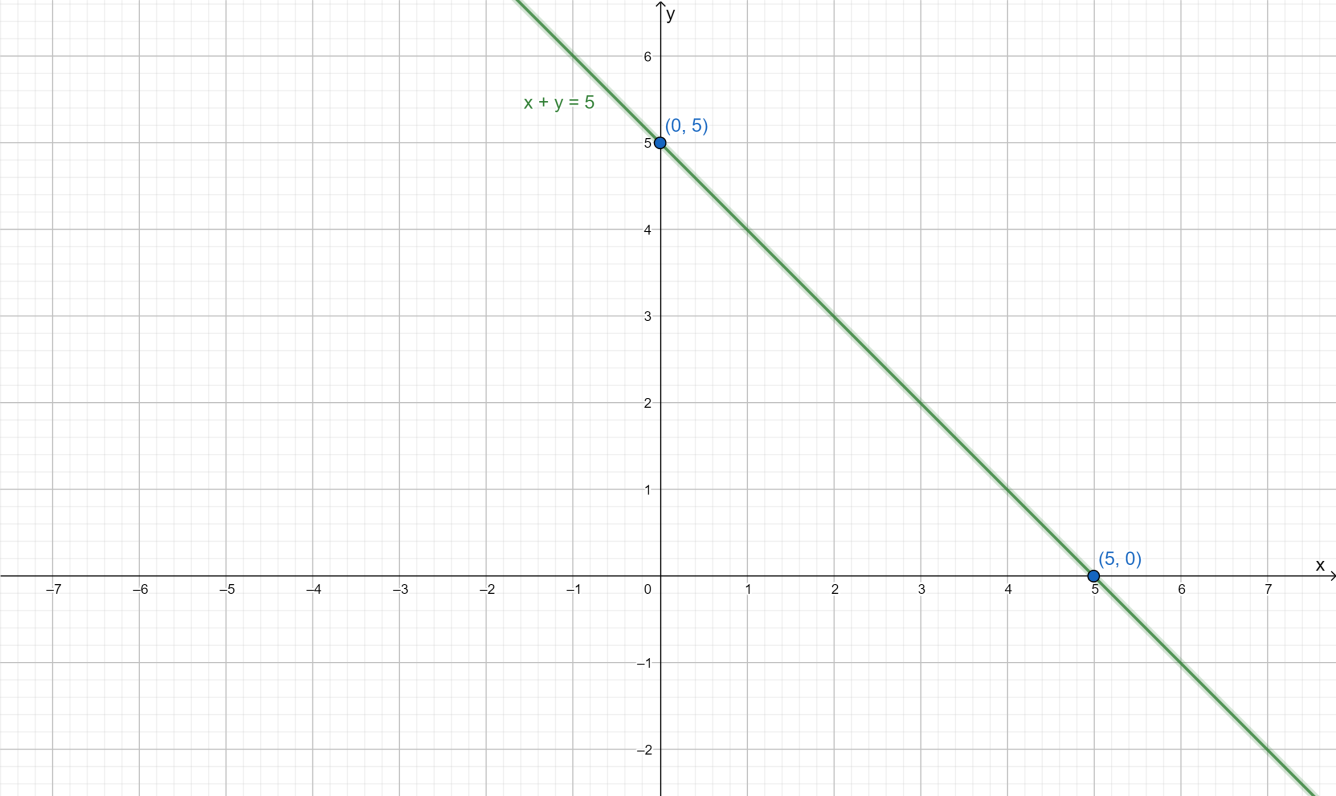
To solve the inequality graphically we first plot the equation corresponding to the given inequality.
The equation corresponding to the inequality x+y<5 is x+y=5 .
We have to first plot the graph for the equation x+y=5 in a two-dimensional plane.
To draw the line for equality we have to find two points through which the line passes.
To find the x - intercept we put y=0 in the equality.
Substituting y=0 in the equation x+y=5 we get
x+y=5
⇒x+0=5
⇒x=5
∴ The x - intercept is 5.
Similarly, to find the y - intercept we put x=0 in the equality.
Substituting x=0 in the equation x+y=5 we get
x+y=5
⇒0+y=5
⇒y=5
∴ The y- intercept is 5 .
∴ The required points used to plot the graph are (0,5) and (5,0) Therefore, to draw the graph we plot the points on the graph and join them to represent the equality.
Now, we have to perform the origin test to find the region satisfied by the inequality. We can check that the point (0,0) does not satisfy the equation x+y=5 . We put the point (0,0) in the inequality and verify if the point satisfies the inequality.
∴x+y=0+0=0<5
So the origin satisfies the inequality.
∴ The region lying towards the origin is the solution to the inequality x+y<5 .
From the graph, we can see that the shaded region is the solution for the inequality x+y<5 in a two-dimensional plane.
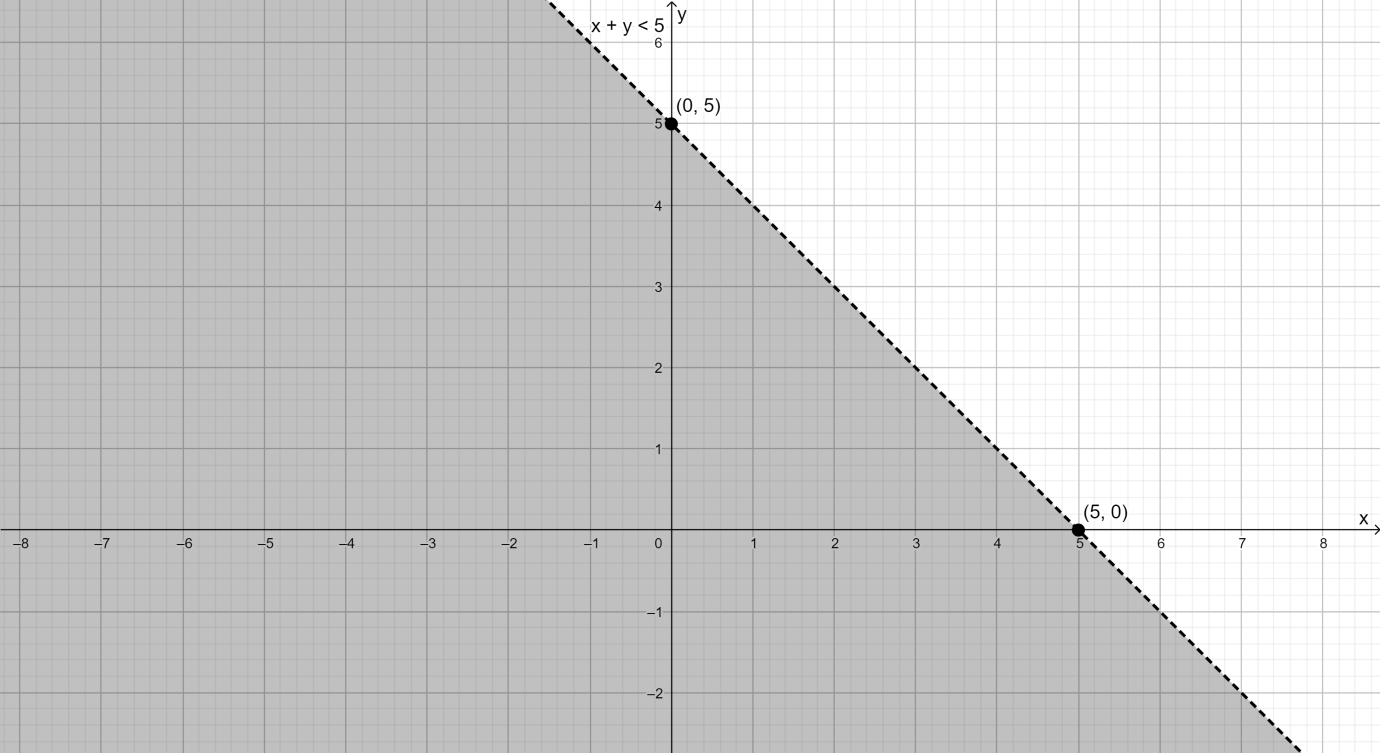
Note: We should keep in mind that in the origin test the point (0,0) will not satisfy the equality. But depending on whether it will satisfy the inequality or not we will be able to verify the solution region of the inequality in the graph. To represent the solution region of the inequality there is the dotted line in the graph because it excludes the line x+y=5 to represent it.