Question
Question: Solve the given inequalities graphically: \(x + 2y \leqslant 10\), \(x + y \geqslant 1\), \(x - y \l...
Solve the given inequalities graphically: x+2y⩽10, x+y⩾1, x−y⩽0, x⩾0, y⩾0.
Solution
Here, in the given question, we need to draw the graphical solution of the given inequalities. Firstly, we will convert the inequalities into equations. Then, we will find out the points through which the line passes and draw a graph including all the line equations given in the conditions. The darkest shaded region will be our graphical solution of the given inequalities.
Complete step-by-step solution:
First we solve x+2y⩽10
Let us first draw graph of x+2y=10....(i)
On putting x=0 in (i), we get
⇒0+2y=10
⇒2y=10
On canceling common factors, we get
⇒y=5
On putting y=0 in (i), we get
⇒x+2×0=10
⇒x=10
Therefore, points to be plotted are: (0,5) and (10,0).
Checking for (0,0). Putting x=0 and y=0
⇒x+2y⩽10
⇒0⩽10
Which is true. Hence the solution set of x+2y⩽10 is the region in the xy plane which contains the origin. Inequality (i) represents the region below the line.
Now we solve x+y⩾1
Let us first draw graph of x+y=1.....(ii)
On putting x=0 in (ii), we get
⇒0+y=1
⇒y=1
On putting y=0 in (ii), we get
⇒x+0=1
⇒x=1
Therefore, points to be plotted are: (0,1) and (1,0).
Checking for (0,0). Putting x=0 and y=0
⇒x+y⩾1
⇒0⩾1
Which is false. Hence the region in the xy plane which does not contain the origin represents the solution set of this inequation. Inequality (ii) represents the region above the line.
Now we solve x−y⩽0
Let us first draw graph of .x−y=0....(iii)
On putting x=0 in (ii), we get
⇒0−y=0
⇒y=0
On putting y=2 in (ii), we get
⇒x−2=0
⇒x=2
Therefore, points to be plotted are: (0,0) and (2,2).
As we can see, here origin lies on the line. To check which side of line would be included in the solution area we will check for the point (10,0)
Checking for (10,0). Putting x=10 and y=0
⇒x−y⩽0
⇒10−0⩽0
⇒10⩽0
Which is false. Hence, inequality (iii) represents the region above the line.
For x⩾0, y⩾0,
Since both x and y are greater than 0, the solution area would be in the 1st quadrant.
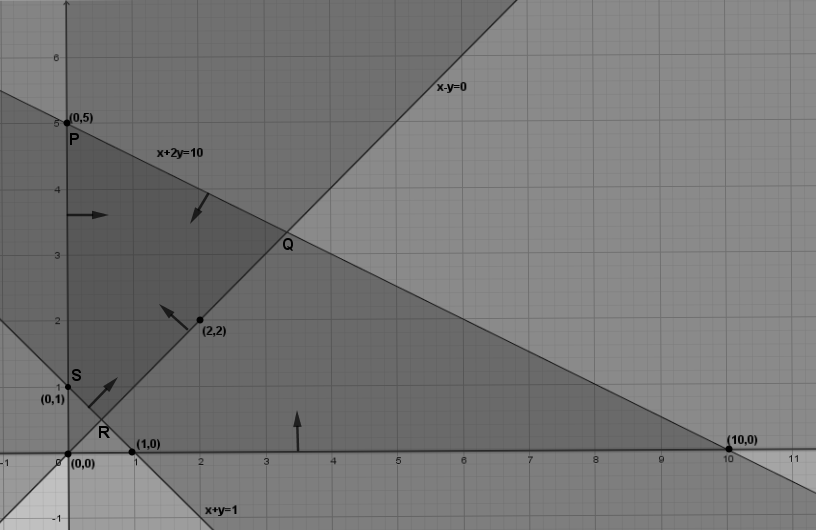
Now we will plot the graph which contains the given inequalities:
Hence, the solution area for the given inequalities would be the darkest shaded region i.e., region PQRS of the graph satisfying all the given inequalities.
Note: Always choose a point which doesn’t lie on the same line, if possible choose (0,0), then substitute its coordinates in the inequation to check which region should be shaded. Here, in the given question, we are given inequalities with ⩽ or ⩾ symbols, so we plotted a solid line. But inequalities that use < or > symbols are plotted with a dashed line to show that the line is not included in the region.