Question
Question: Solve the given equation \[x - y = 1\] and plot its graph....
Solve the given equation x−y=1 and plot its graph.
Solution
To solve the given equation, we will at first convert the given equation in slope intercept form. After converting the equation into the slope intercept form, we will find x and y intercepts of the given equation. Eventually, we will graph the equation with the help of x and y intercepts.
Complete step-by-step solution:
We know that the standard slope intercept form of the equation is given by, y=mx+c where m is the slope of the equation and c is y intercept.
We have,
⇒x−y=1
Reducing the equation into slope intercept form,
Subtract x from both the side,
⇒x−y−x=1−x
⇒−y=1−x
Now, multiplying both the sides with -1
Therefore,
⇒(−1)(−y)=(−1)(1−x)
⇒y=x−1
This gives, ⇒m=1
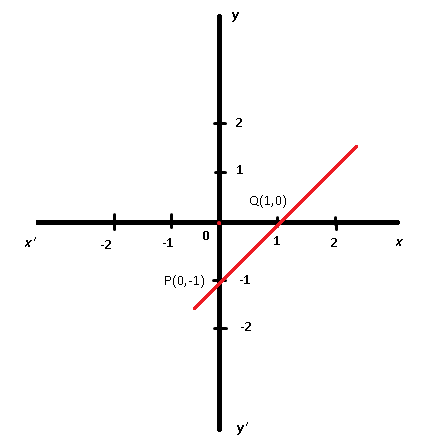
Now we know y intercept is -1, therefore, the point where the line touches y axis is, say P (0,-1).
Now, to find x intercept we put the value of y=0
Therefore, we get x=1
Thus, the point where the line touches the x axis is, say Q (1, 0).
Now, we plot these two points P and Q on the graph, join them both to get the graph of the given linear equation.
Hence, the plotted graph of the given will be,
Note: It is important to note here that for any value of the variables of the given equation, the line on the graph will remain where it is, it can only be extended in both the direction and cannot be moved. It is very important to plot a graph neatly as sometimes the values of variables can be in fraction and decimal also, hence, plotting a graph neatly is imperative.