Question
Question: Solve the following system of inequalities graphically \(x + y \leqslant 9,y > x,x \geqslant 0\)....
Solve the following system of inequalities graphically x+y⩽9,y>x,x⩾0.
Solution
Hit – In this question plot the different inequalities given onto a single graph paper. First plot the straight line x + y=9, then a straight line passing through origin x=y and then search for the portion on graph for which x⩾0 satisfies. Find the points of intersection and mark the regions that satisfy individual inequality, find the region in common.
Complete step-by-step solution -
Given system of inequalities
x+y⩽9,y>x,x⩾0
Now we have to solve these inequalities graphically.
So plot these inequalities as above.
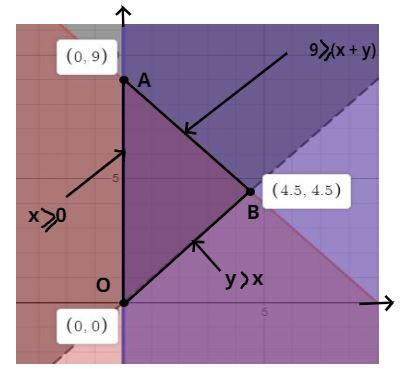
So the solution of these inequalities is a triangle OAB as shown in figure.
Whose coordinates are also shown in the above figure.
The solution of x+y⩽9,y>x is point B whose coordinates is (4.5, 4.5).
We can also solve this manually when inequalities hold the equation becomes
x + y = 9 and y = x
⇒2x=9
⇒x=29=4.5=y
So the coordinates of point B is (4.5, 4.5)
The solution of x+y⩽9,x⩾0 is point A whose coordinates is (0, 9).
We can also solve this manually when inequalities hold the equation becomes
x + y = 9 and x = 0
⇒0+y=9
⇒y=9
So the coordinates of point A is (0, 9).
The solution of y>x,x⩾0 is point O whose coordinates is (0, 0).
We can also solve this manually when inequalities hold the equation becomes
y = x and x = 0
⇒y=x=0
So the coordinates of point O is (0, 0).
So this is the required solution of the system of inequalities.
Note – The graphical plotting of inequalities is mandatory while solving problems of this kind. Here the question arise that why have we plotted x + y=9 and y=x although we needed to solve x+y⩽9,y>x, this is because the inequality depicts area however the line depicts the boundary of this area, thus to track this area its boundary needs to be sketched.