Question
Question: Which of the following curves represents the Henry's law?...
Which of the following curves represents the Henry's law?
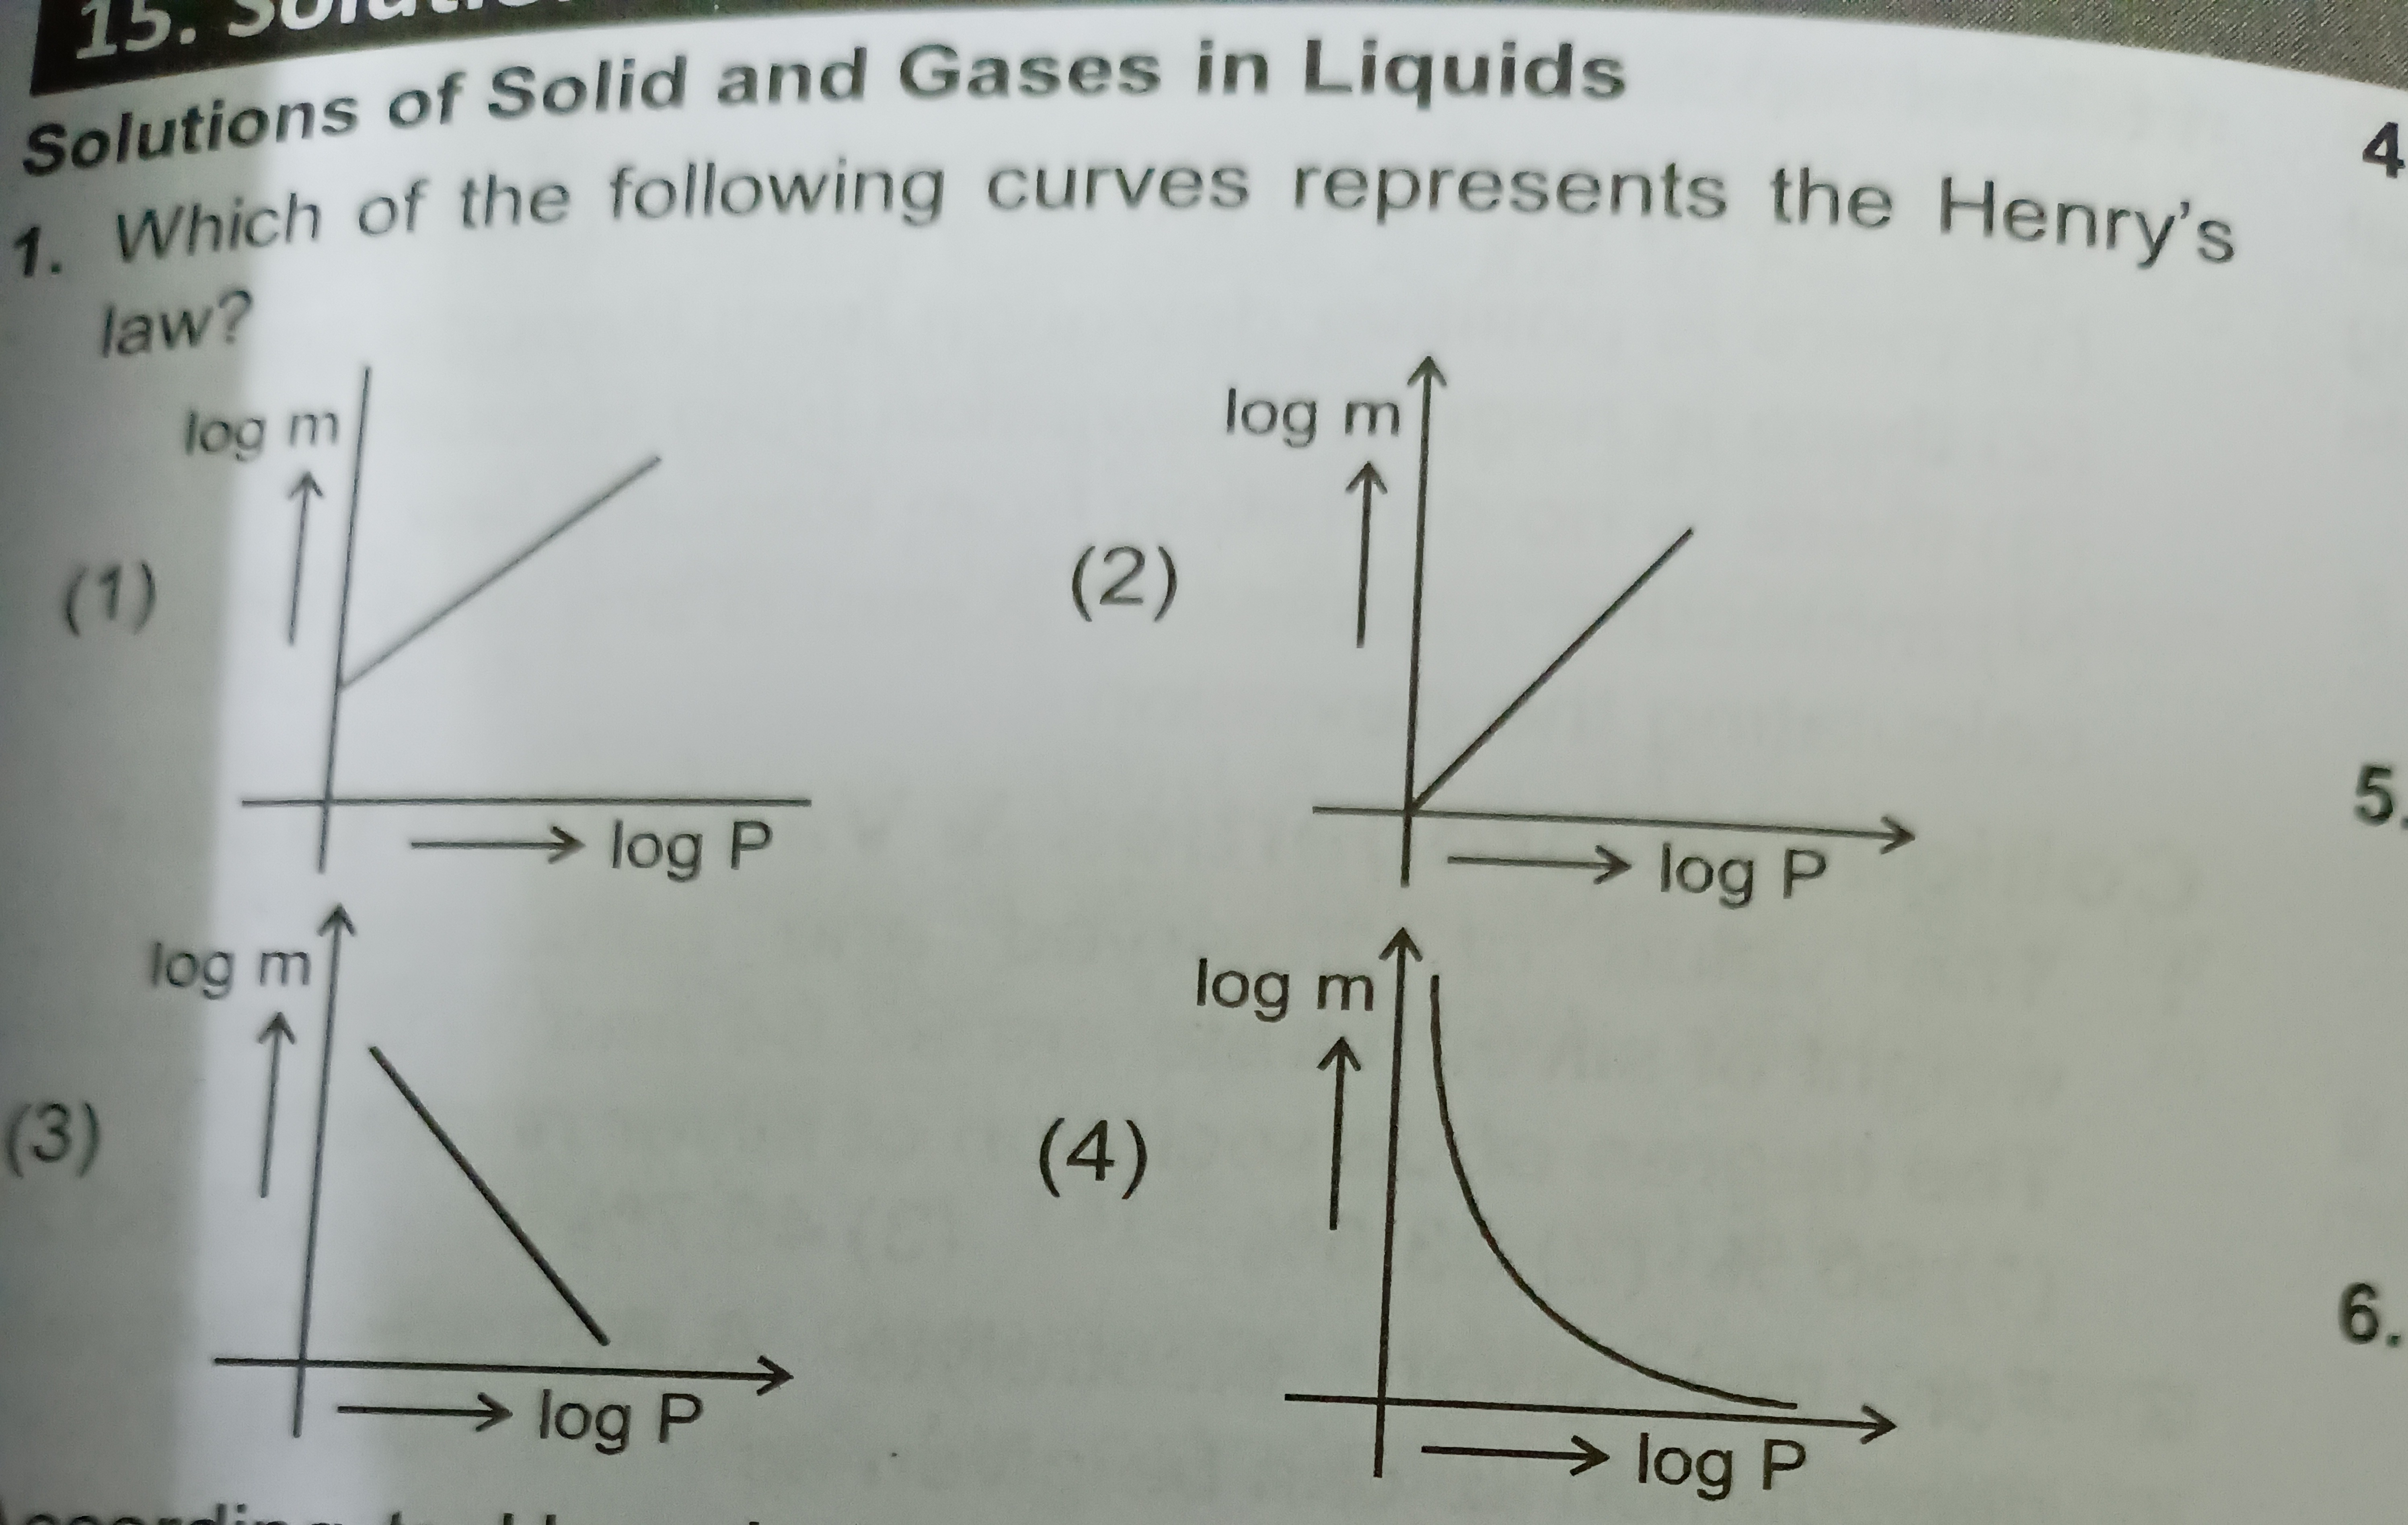
Graph (1): Shows a straight line with a positive slope and a positive y-intercept.
Graph (2): Shows a straight line with a positive slope passing through the origin (zero y-intercept).
Graph (3): Shows a straight line with a negative slope.
Graph (4): Shows a curve, not a straight line.
Graph (1): Shows a straight line with a positive slope and a positive y-intercept.
Solution
Henry's Law states that the partial pressure of a gas in the vapor phase (P) is proportional to the mole fraction of the gas (x) in the solution.
P=KHx
where KH is Henry's Law constant.
Rearranging this equation to express the solubility (or concentration, represented by 'm' in the question) in terms of pressure:
x=KH1P
Let 'm' represent the solubility or concentration of the gas in the liquid, so m∝P. We can write this as:
m=kP
where k=KH1 is a proportionality constant.
To represent this relationship on a log-log plot (i.e., logm vs logP), we take the logarithm of both sides of the equation m=kP:
logm=log(kP)
Using the logarithm property log(AB)=logA+logB:
logm=logk+logP
This equation is in the form of a linear equation Y=c+X, where:
Y=logm (on the y-axis) X=logP (on the x-axis) c=logk (the y-intercept)
The slope of this line is 1.
Graph (1) represents the most general case where the constant k can have any positive value, leading to a non-zero intercept (logk).