Question
Question: Sketch the graph of \(y = {\log _{\dfrac{1}{2}}}x\) and \(y = {\left( {\dfrac{1}{2}} \right)^x}\)?...
Sketch the graph of y=log21x and y=(21)x?
Solution
We have given two equations. The first equation is a logarithmic function and the second equation is an exponential function. To draw the graph of the logarithmic function, we substitute the positive values of x as the domain of the logarithmic function is as the domain of the logarithmic function is R+ .
To draw the exponential function, we substitute all the real numbers as the domain of the exponential function is R .
Complete step by step solution:
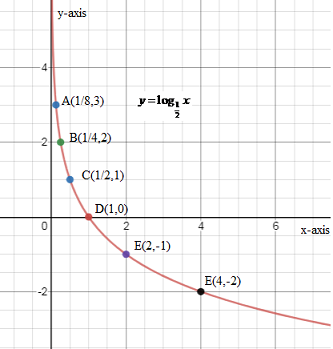
Step 1: We have given two functions: y=log21x and y=(21)x . First, we draw the graph of y=log21x. For that, we substitute the different values of x . The following table shows the values of y for different values of x.
| x | 1 | 21 | 41 | 81 | 2 | 4 |
|---|---|---|---|---|---|---|
| y=log21x | log211 ⇒0 | log2121 ⇒1 | log2141 ⇒2 | log2181 ⇒3 | log212 ⇒−1 | log214 ⇒−2 |
Step 2: Now we draw the graph of the logarithmic function y=log21x. Following is the graph of y=log21x
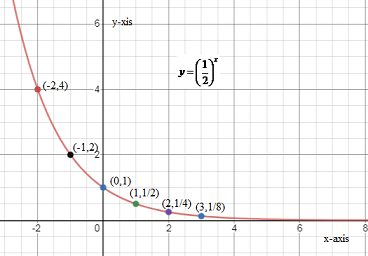
Step 3: Now, we draw the graph of y=(21)x. For that, we substitute the different values of x . The following table shows the values of y for different values of x.
| x | 0 | 1 | −1 | 2 | −2 | 3 |
|---|---|---|---|---|---|---|
| y=(21)x | (21)0 ⇒1 | (21)1 ⇒21 | (21)−1 ⇒2 | (21)2 ⇒41 | (21)−2 ⇒4 | (21)3 ⇒81 |
Step 4: Now we draw the graph of the logarithmic function y=(21)x. Following is the graph of y=(21)x.
Step 5: The plot of both the function on the same graph is as follows:
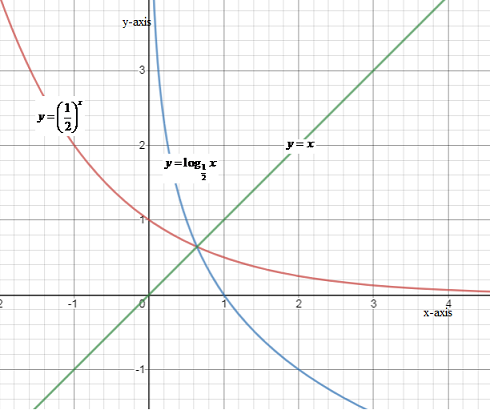
From the above curve, it is clear that both the curves are symmetric about the line y=x .
Note: The logarithmic function is undefined for negative values of x .
The value of the exponential function is always positive.
Graph of the logarithmic function and exponential function is symmetric about the line y=x. Choose the values of x such that it is an integer power of the base, so we can determine the value of the logarithmic function.