Question
Question: Sketch the graph for \( y = {\tan ^{ - 1}}(\tan x) \)...
Sketch the graph for y=tan−1(tanx)
Solution
To sketch the graph of y=tan−1(tanx) . First, we have to calculate the domain and range of tanx and tan−1 . From this, we can sketch the graph of tanx and tan−1 . With the help of these, we can draw a graph of y=tan−1(tanx)
In a relation R from set A to set B, the set of all first components of order pair belongings to R is called the domain and all the second element of pair is called range.
Complete step by step solution:
We know that the domain of tan. function(tangent function) is the set \left\\{ {x:x \in R,and.x \ne (2n + 1)\dfrac{\pi }{2},n \in Z} \right\\}
here R represents the real number and x=(2n+1)2π means the domain of tan function does not contain an odd multiple of 2π . n∈Z Represents that n is an integer. Z is the symbol of an integer.
The range of the tan function in R. Here R represents the real number. If we restrict the domain of a tangent function to (2−π,2π) then it is one-one and onto with the range R. So, the tangent function is restricted to any of interval etc, is bijective and range is R. SO, tan−1 can be defined as the function whose domain is R and range could be any of interval (2−3π,2π),(2−π,2π),(2π,23π) and so on. This interval gives different branches of the function tan−1 . The branch (2−π,2π) is called the principal value branch of the function tan−1 therefor tan−1:R→(2−π,2π)
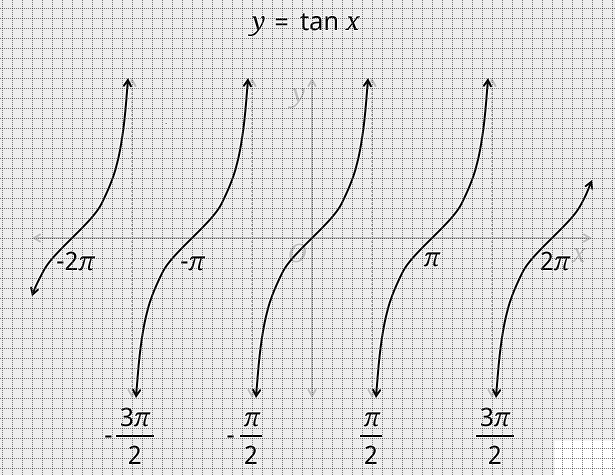
The graph of a tan function y=tanx is given as:
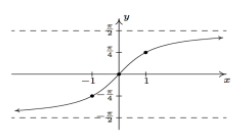
The graph of y=tan−1x is given as
As y=tan−1(tanx) is periodic with period π. therefore to draw this graph we should draw the graph for one interval π and repeat for the entire value.
As we know that y=tan−1(tanx) = \left\\{ {x:\dfrac{\pi }{2} < x < \dfrac{\pi }{2}} \right\\}
This has been defined for 2π<x<2π that has a length π so its graph could be plotted as
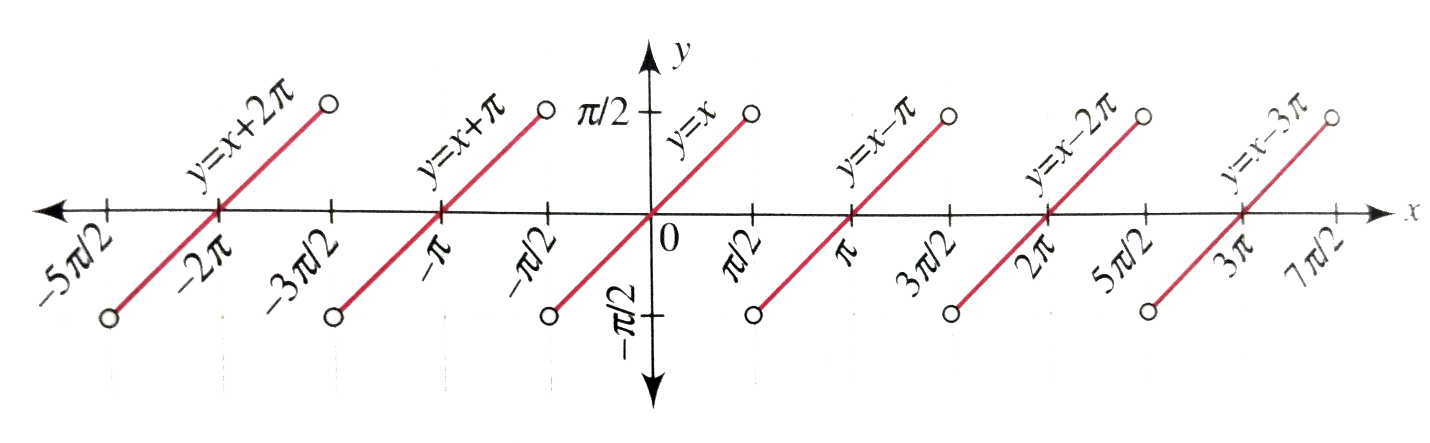
Thus this graph of y where y is not defined for x∈(2n+1)2π .
Note:
One-one function: A function f:x→y is defined as a one-one function of the image of distinct elements of X under f are distinct.
Onto function: A function is f:x→y said to be onto the function of every element of Y is an image of some element of X under f.
Bijective Function: The function which is both one-one and onto is called the bijective function.