Question
Question: Sketch the graph for \[y = {\tan ^{ - 1}}\left( {\tan x} \right)\] ....
Sketch the graph for y=tan−1(tanx) .
Solution
Here, we have to sketch a graph of inverse tangent function. We will plot the graph with the polar coordinates. The tangent function is a periodic function. A periodic function repeats its values at regular intervals or periods of time, for example,all the trigonometric functions repeat at intervals of 2π radians. Periodic functions are also used in the science field to describe waves, oscillations, and other phenomena that exhibit periodicity.
Complete step-by-step answer:
We have to sketch a graph for y=tan−1(tanx).
We know that tanx is periodic at period π, tanx lies between 0 to ∞.
Therefore, x lies between −2π to 2π.
The curve has been defined well for 2nπ but is not well defined for (2n+1)π .
Therefore, the graph is plotted as tanx tends to ∞.
Thus the graph of y=tan−1(tanx) is shown as below:
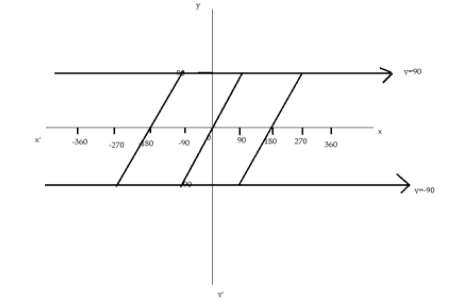
Note: A common mistake made since tan−1 and tan are reciprocal functions, we tend to cancel each other and make that y=x . To sketch the graphs of the trigonometric functions we need to know the period, phase, amplitude, maximum and minimum turning points.
These graphs are used in many areas of engineering and science. Few of the examples are the growth of plants and animals, waves, etc. The tangent will be zero whenever the numerator (the sine) is equal to zero. This happens at 0,π,2π etc, and at−π,−2π etc.
Let's just consider the region from −π to 2π , for now. So the tangent will be zero (that is, it will cross the x-axis) at −π,0,π,2π .The tangent will be undefined whenever its denominator (the cosine) is zero.