Question
Question: Sketch the graph for \(y={{\sec }^{-1}}\sec x\)....
Sketch the graph for y=sec−1secx.
Solution
Hint: In this question, we will first write secant function in terms of cos then understand the relation of cosx and cos−1x. We will observe the graph of cosx , and how they change signs and use it to plot a graph of y=sec−1secx.
Complete step-by-step answer:
In given question, we have,
y=sec−1secx
This can be written as
secy=secx.
We know that secx=cosx1, therefore, we can write above equation as,
cosy1=cosx1
Cross multiplying this, we get,
cosx=cosy
This can be written as,
y=cos−1cosx.
So, the graph of y=sec−1secx is the same as the graph of y=cos−1cosx.
Now, cosx is a periodic function with period 2π, which means its values repeat in the same pattern after 2π increases in x. That is, cosx=cos(2π+x).
Since, cos x is periodic with period 2π. Therefore, y=cos−1cosx is also period with period 2π.
Also, the domain here is a set of those values of x for which cos−1cosx is defined. And, range is the set of values where cos−1cosx lies.
Now, for all real values of x, cosx lies between -1 and 1. And, between -1 and 1, the inverse function of cosine is defined. Therefore, cos−1cosx is defined for all real values ofx.
We know, graph of y=cosx is:
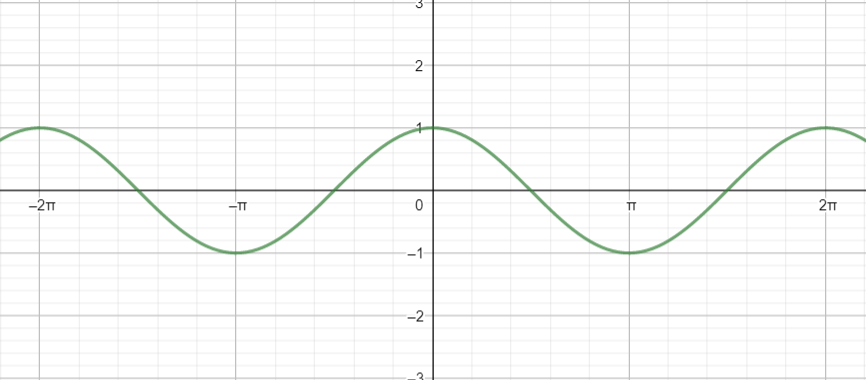
We see that, in the interval [−π,π] , for two different values of x , we have the same value of y.
Also, from definition of cosine inverse, in this graph, we get,
cos−1y=x
If we substitute y=cosx here, we get,
cos−1cosx=x.
Now, in graph of cos−1cosx, we have,
y=cos−1cosx
⇒y=x
But, in the interval [−π,π] , for two different values of x , we have the same value of y .
Let those two different values be represented by y1,y2.
Now, as x increases from −π to 0, cosx increases from -1 to 1, and hence, cos−1cosx decreases from π to 0. Therefore, here we will have, y1=−x.
And as it increases from 0 to π, cosx decreases from 1 to -1, and hence, cos−1cosx increases from 0 to π. Therefore, here we will have, y2=x .
Also, from −π toπ, the length of interval is 2π and cos−1cosx periodic with period 2π. Therefore, the rest of the graph will repeat the same as in interval [−π,π].
Hence, the graph of cos−1cosx is given by:
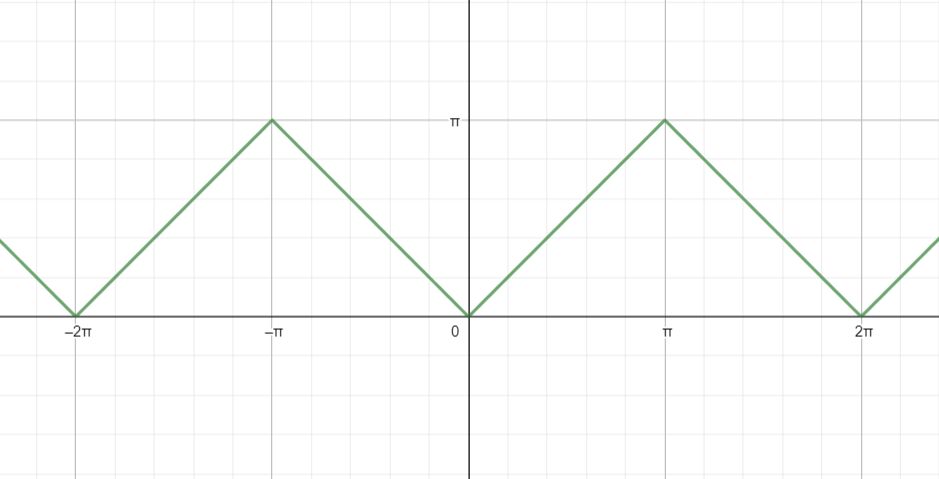
Hence for the graph of y=sec−1secx is plotted above.
Note: While plotting the graph, keep in mind that for two different values of x , cos−1cosx will have the same value in interval of length 2π. So, looking at y=x, do not directly plot a graph of an infinite straight line.