Question
Question: Sketch the graph for \[y = {\cos ^{ - 1}}\left( {\cos x} \right)\]...
Sketch the graph for y=cos−1(cosx)
Solution
Here we need to draw the given inverse trigonometric function. For that, we will use the periodicity of inverse trigonometric functions. Then we will find the value of the given function by putting the random values of the variable. Also, the pattern graph of this function will repeat after a certain period and that period is known as the periodicity of the function.
Complete step by step solution:
Here we need to sketch the graph of the function y=cos−1(cosx).
We know the period of the given inverse trigonometric function is equal to 2π.
Therefore, to draw this graph we should draw the graph for one interval of length 2π and we will repeat the same for entire values of x of length 2π.
We know that the value of the given function i.e. y=cos−1(cosx) is equal to x when 0<x<π i.e. y=cos−1(cosx)=x when 0<x<π.
We also know that the value of the given function i.e. y=cos−1(cosx) is equal to 2π−x when π<x<2π i.e. y=cos−1(cosx)=2π−x when π<x<2π
Thus, it has been defined for 0<x<2π that has length of 2π . So, its graph could be plotted as:
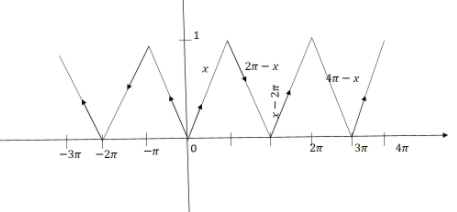
This is the required sketch of the graph for the given function y=cos−1(cosx).
Note:
We have seen that the periodicity of the given function is 2π. If the value of the function repeats after a constant period, then we say that the given function is a periodic function. Since the periodicity of the given function is 2π, so it is repeating its values after the interval of 2π. In trigonometry, we define the period of trigonometric functions as the distance between the repetitions of any function.