Question
Question: Sketch the curve for \(\sin y=\sin x\)?...
Sketch the curve for siny=sinx?
Solution
In the given question, we are given an equation of sine trigonometric function with two different angles x and y which we need to equate. Now, we need to use the fact that the value of the sine function repeats after one cycle from 0 to 2π .
Complete step-by-step solution:
In the question we are given that, siny=sinx.
Now, proceeding further we get,
siny=sinx⇔y=nπ+(−1)nxfor n∈Z .
Putting n=0, we can clearly see that y=x is on the graph and now putting n=1, we can see that y=−x+π also lie on the graph.
So, now for this if we take the even values of n, we can have the set of straight lines:
y=x+−4π , y=x+−2π,y=x+2π,y=x and we can get it so forth.
And also, if we choose the values of n as odd values, we again have the straight lines:
y=−x−3π ,y=−x−π ,y=−x+π ,y=−x+3π and we can get it so forth.
siny=sinx⇔y=2kπ+x or y=π−x+2kπ for some k∈Z .
The two equations on the right-hand side of the equivalence correspond to lines.
Therefore, the set \left\\{ \left( x,y \right)\in {{R}^{2}}|\sin x=\sin y \right\\} and over this the function is not defined. The graph of this equation we get is the criss-cross lines of such lines. So, the curve we get is:
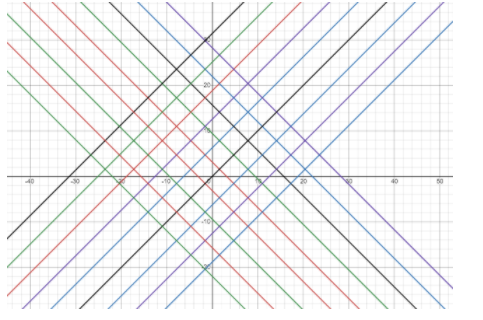
Note: In the given question we are supposed to find the domain over which the function is defined and in order to plot it. Apart from this we must generalise the domain in order to plot it generally and hence we will get the graph.