Question
Question: Logarithms of readings of pressure and volume for an ideal gas were plotted on a graph as shown in F...
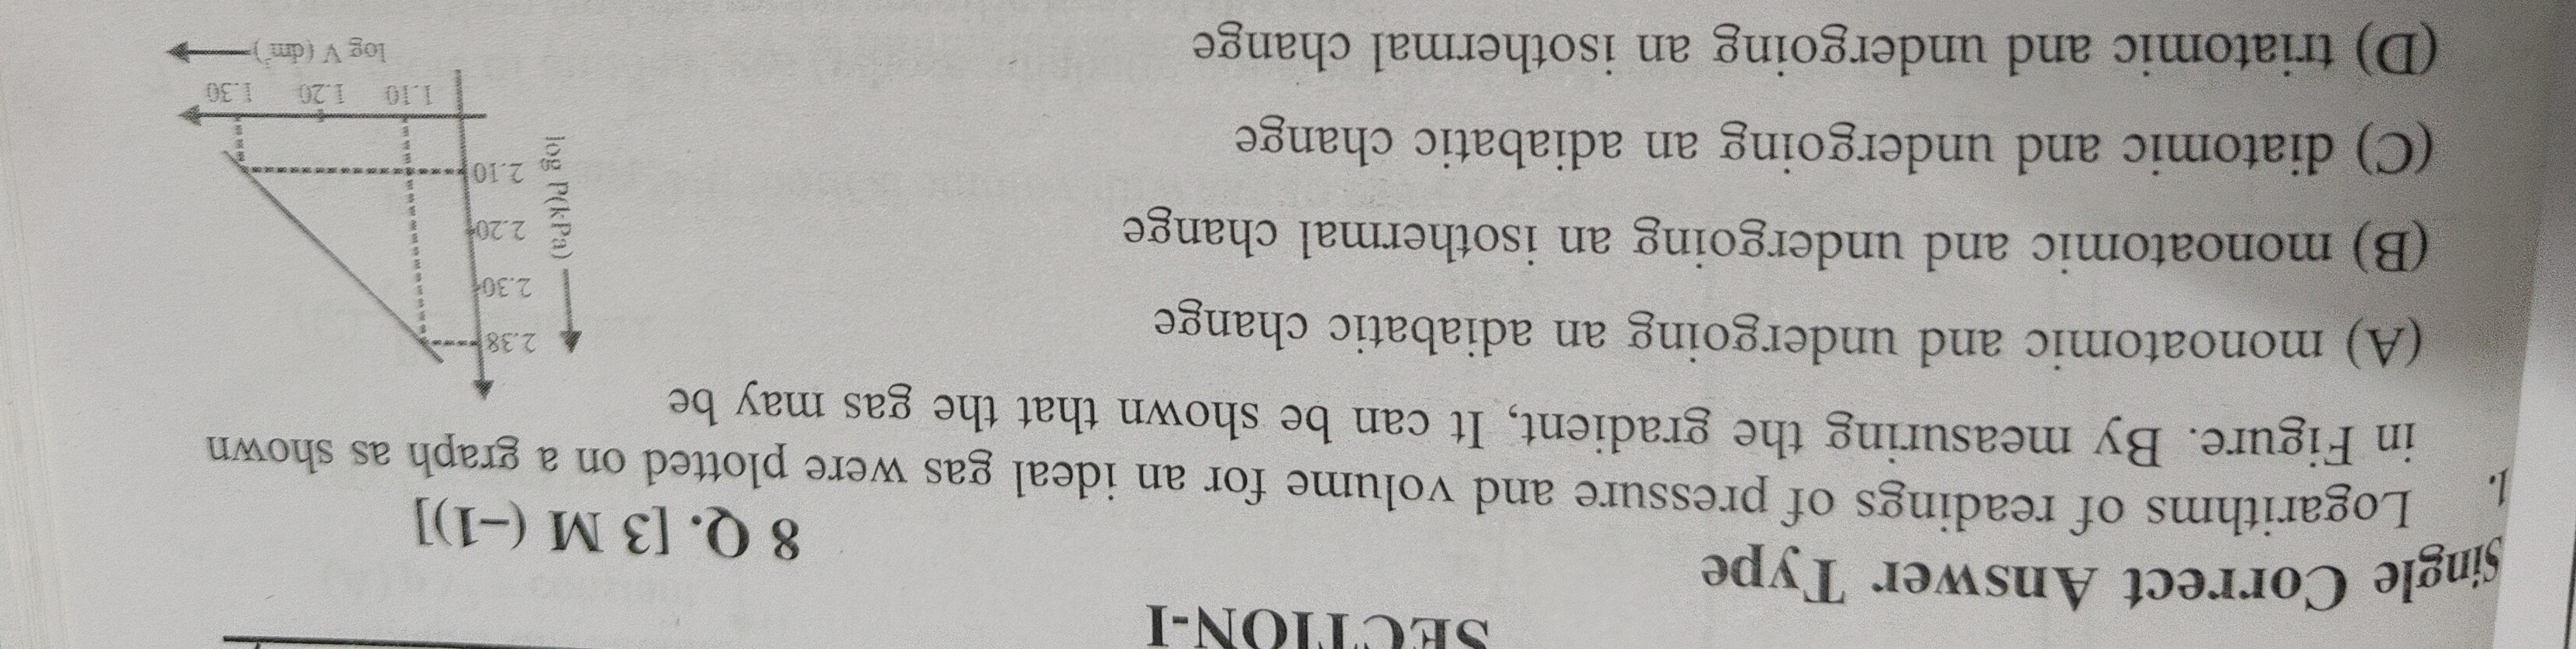
Logarithms of readings of pressure and volume for an ideal gas were plotted on a graph as shown in Figure. By measuring the gradient, It can be shown that the gas may be
A
monoatomic and undergoing an adiabatic change
B
monoatomic and undergoing an isothermal change
C
diatomic and undergoing an adiabatic change
D
triatomic and undergoing an isothermal change
Answer
diatomic and undergoing an adiabatic change
Explanation
Solution
The plot of logP vs logV for an adiabatic process PVγ=constant has a slope of −γ. From the graph, the slope is calculated as 1.30−1.102.10−2.38=−1.4. Thus, γ=1.4. This value corresponds to a diatomic gas (γ=7/5). An isothermal process has a slope of −1, which is not observed.