Question
Question: Show on a graph, the variation of resistivity with temperature for a typical semiconductor....
Show on a graph, the variation of resistivity with temperature for a typical semiconductor.
Solution
Recall the formula for resistivity for a semiconductor. Deduce how temperature affects the resistivity of a material. After finding out the relation, match it with the standard graphs know and then draw the required graph
Formula Used:
ρ=ne2τm
Complete step by step solution:
The resistivity is given by: ρ=ne2τm where
n= Number density of electrons
τ= Relaxation time
With the rise in temperature, the number density of electrons and holes (in case of semiconductors) increases, where τ remains constant. So, ρ (resistivity) decreases with increase in temperature.
From the above, we can infer that ρ∝T1
Thus it is of the form y=xk
The graph of it is a hyperbolic curve. Also resistivity and temperature also cannot be equal to zero or negative. Hence we get the curve only in the first quadrant.
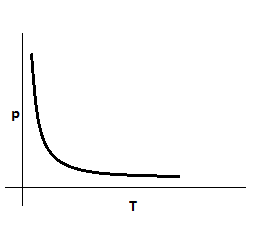
This the required graph of the question
Additional Information: Resistivity is a property of the material. It changes with the material and temperature. It is the electrical resistance of a conductor of unit cross-sectional area and unit length.
Semiconductors are materials which have a conductivity between conductors (generally metals) and nonconductors or insulators (such as most ceramics). Semiconductors can be pure elements, such as silicon or germanium, or compounds such as gallium arsenide or cadmium selenide. The resistivity of a semiconductor decreases with temperature.
Note: This graph is unique; it is for only semiconductors. The graph is different for other materials. It is a straight line with positive slope for metals and conductors as for conductors the resistivity increases linearly with increase in temperature.