Question
Question: The velocity-time graph of a body is shown in figure. The ratio of the ...during the intervals OA an...
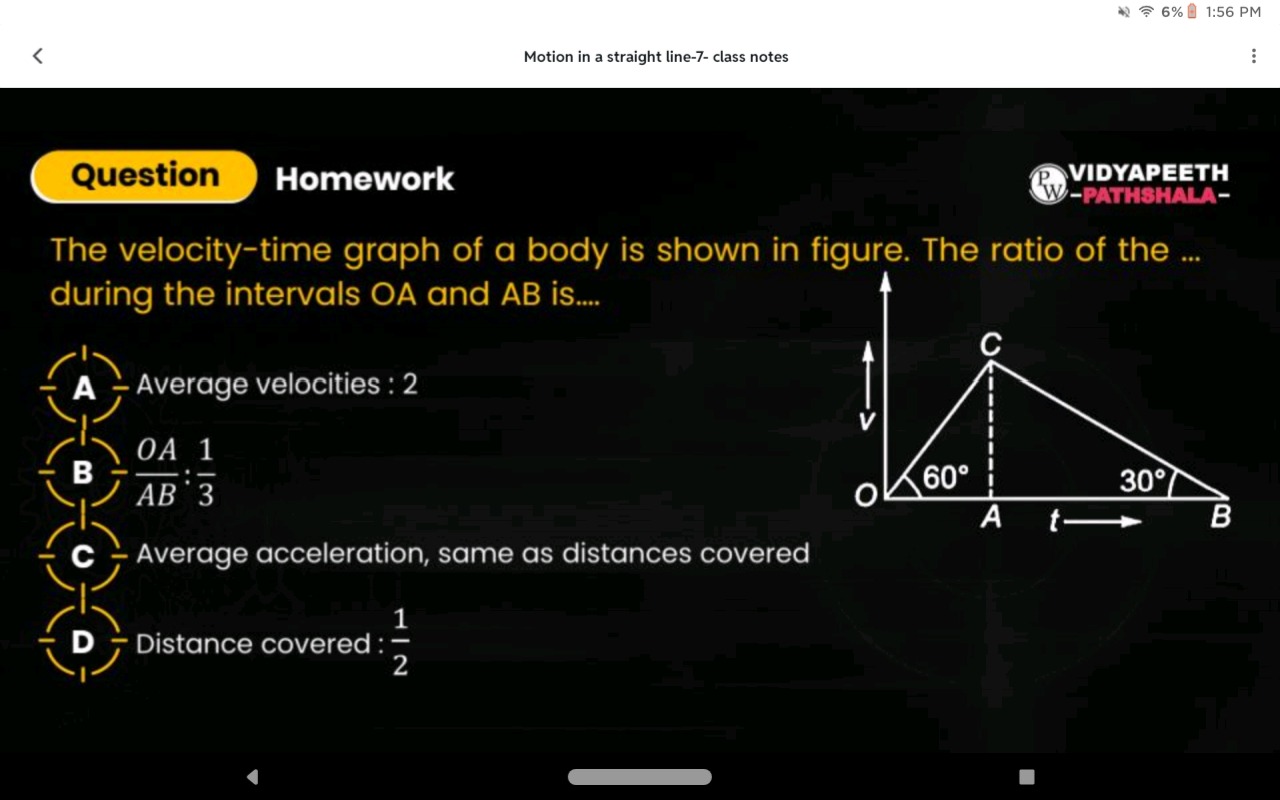
The velocity-time graph of a body is shown in figure. The ratio of the ...during the intervals OA and AB is....
Average velocities : 2
ABOA:31
Average acceleration, same as distances covered
Distance covered: 21
ABOA:31
Solution
The problem asks for the ratio of a certain physical quantity during the intervals OA and AB, based on the provided velocity-time (v-t) graph. The specific quantity is not mentioned in the question prompt but can be inferred from the options.
Let VC be the maximum velocity attained at point C, and let tA be the time corresponding to point A. The time duration for interval OA is tOA=tA. The time duration for interval AB is tAB=tB−tA.
1. Analyze Interval OA:
The graph for interval OA is a straight line starting from the origin (0,0) and ending at (tA,VC).
The slope of the v-t graph represents acceleration.
The angle the line OA makes with the time axis is 60∘.
So, the acceleration during OA is aOA=tan(60∘)=3.
Also, aOA=tA−0VC−0=tAVC.
From this, we get VC=3tA. (Equation 1)
2. Analyze Interval AB:
The graph for interval AB is a straight line starting from (tA,VC) and ending at (tB,0).
The angle the line CB makes with the time axis is 30∘. The slope is negative as velocity is decreasing.
The magnitude of acceleration (deceleration) during AB is ∣aAB∣=tan(30∘)=31.
Also, aAB=tB−tA0−VC=−tABVC.
So, ∣aAB∣=tABVC=31.
From this, we get VC=31tAB. (Equation 2)
3. Compare Time Durations (from Option B):
From Equation 1 and Equation 2, we can equate the expressions for VC:
3tA=31tAB
Multiplying both sides by 3:
3tA=tAB
The ratio of time durations tABtOA=tABtA=31.
Option B states "ABOA:31". Since OA and AB represent the time intervals on the graph, this option refers to the ratio of time durations, which is 1/3. So, option B is consistent with our calculation.
4. Check other quantities:
a) Average Velocities (from Option A):
Average velocity for uniform acceleration/deceleration is (initial velocity + final velocity) / 2.
Average velocity for OA: Vavg,OA=20+VC=2VC.
Average velocity for AB: Vavg,AB=2VC+0=2VC.
The ratio of average velocities Vavg,ABVavg,OA=VC/2VC/2=1.
Option A states "Average velocities : 2", which is incorrect.
b) Distances Covered (from Option D):
Distance covered is the area under the v-t graph.
Distance covered in OA: dOA=Area of triangle OAC=21×base×height=21×tA×VC.
Distance covered in AB: dAB=Area of triangle ABC=21×base×height=21×tAB×VC.
The ratio of distances covered dABdOA=21tABVC21tAVC=tABtA.
Since we found tABtA=31, the ratio of distances covered is also 31.
Option D states "Distance covered: 21", which is incorrect.
c) Average Acceleration (from Option C):
Magnitude of average acceleration for OA: ∣aOA∣=3.
Magnitude of average acceleration for AB: ∣aAB∣=31.
Ratio of magnitudes of average accelerations ∣aAB∣∣aOA∣=1/33=3.
Option C states "Average acceleration, same as distances covered". The ratio of average accelerations (3) is not the same as the ratio of distances covered (1/3). So, option C is incorrect.
Based on the analysis, option B is the only correct statement, indicating that the ratio of the time durations (or distances covered, as both yield 1/3) for intervals OA and AB is 1/3. Given the notation "OA/AB", it most directly refers to the ratio of time durations.