Question
Question: Which of the following graphs correctly represents the variation of thermodynamic properties of Habe...
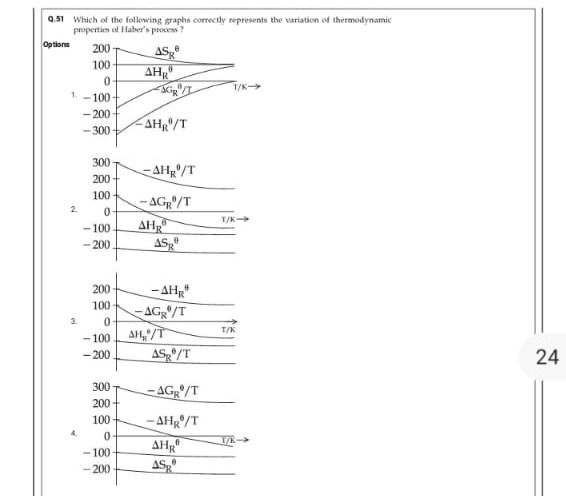
Which of the following graphs correctly represents the variation of thermodynamic properties of Haber's process?
Option 4
Solution
For the Haber process
\ceN2(g)+3H2(g)−>2NH3(g)we know that the reaction is exothermic so that ΔHR∘<0 and, because the number of moles of gas decreases, ΔSR∘<0. Under standard approximations these values are nearly temperature‐independent. Consequently:
-
ΔHR∘ (being negative) stays almost constant (with a slight warming effect due to heat capacity differences).
-
ΔSR∘ (being negative) is nearly constant.
-
ΔGR∘=ΔHR∘−TΔSR∘ will thus vary predominantly as a linear function of temperature.
-
Graphs that plot −ΔHR∘/T and −ΔGR∘/T should show decreasing trends with temperature since the denominators increase.
Among the options, Graph 4 shows:
-
ΔHR∘ starts negative and increases slightly (i.e. becomes less negative).
-
ΔSR∘ is maintained constant at about –180.
-
−ΔGR∘/T and −ΔHR∘/T decrease slightly with temperature.
This behavior correctly reflects the thermodynamic variations expected for the Haber process.