Question
Question: Radioactive element decays to form a stable nuclide, then the rate of decay of reactant is shown by ...
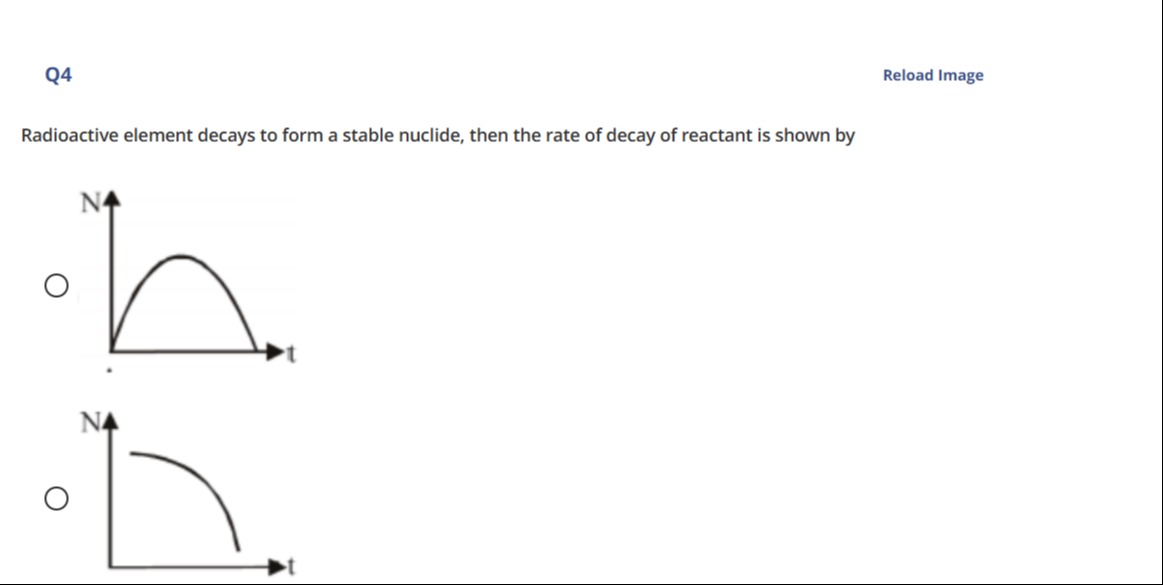
Radioactive element decays to form a stable nuclide, then the rate of decay of reactant is shown by
2
Solution
The rate of decay of a radioactive element is given by the formula R(t)=−dtdN=λN(t), where N(t) is the number of radioactive nuclei at time t and λ is the decay constant.
For a first-order radioactive decay, the number of radioactive nuclei at time t is given by N(t)=N0e−λt, where N0 is the initial number of radioactive nuclei at t=0.
Substituting this into the rate equation, we get R(t)=λN0e−λt.
This equation shows that the rate of decay decreases exponentially with time.
At t=0, the rate of decay is R(0)=λN0, which is the maximum rate.
As time t increases, e−λt decreases, and hence R(t) decreases.
As t→∞, e−λt→0, and hence R(t)→0.
The graph of R(t) versus t is an exponential decay curve, starting from a positive value at t=0 and asymptotically approaching zero as t approaches infinity.
Now let's examine the given graphs. The first graph shows a curve that starts at 0, increases to a maximum, and then decreases to 0. This is not an exponential decay curve.
The second graph shows a curve that starts at a maximum value on the y-axis at t=0 and decreases with time, approaching the x-axis as t increases. This is consistent with an exponential decay curve.
Therefore, the second graph represents the rate of decay of the reactant as a function of time.