Question
Question: The angle of projection of a particle is measured from the vertical axis as $\phi$ and the maximum h...
The angle of projection of a particle is measured from the vertical axis as ϕ and the maximum height reached by the particle is hm. Here hm as function of ϕ can be presented as
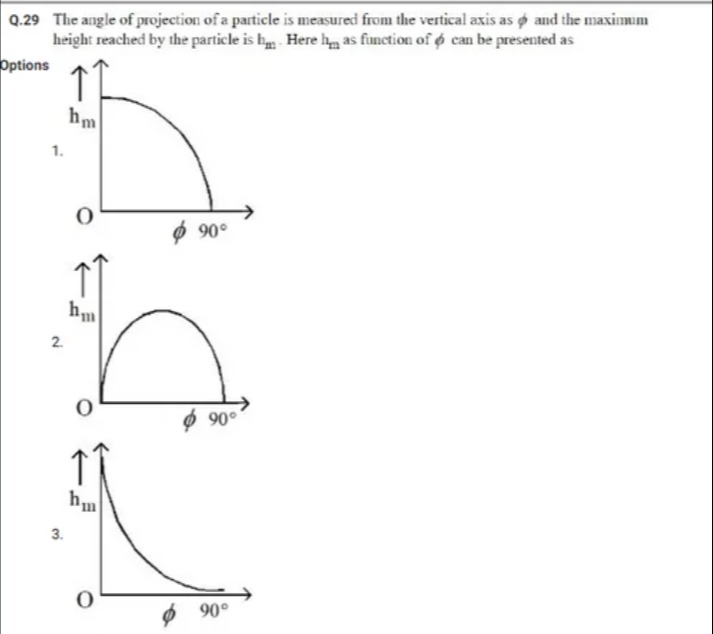
A graph with the x-axis labeled as ϕ and ranging from 0 to 90 degrees, and the y-axis labeled as hm. The curve starts at hm when ϕ is 0 degrees and decreases to 0 when ϕ is 90 degrees. The curve appears to be a quarter circle. The origin is labeled as O. An arrow points upwards next to hm.
A graph with the x-axis labeled as ϕ and ranging from 0 to 90 degrees, and the y-axis labeled as hm. The curve starts at 0 when ϕ is 0 degrees, increases to a maximum value, and decreases to 0 when ϕ is 90 degrees. The curve appears to be a half circle. The origin is labeled as O. An arrow points upwards next to hm.
A graph with the x-axis labeled as ϕ and ranging from 0 to 90 degrees, and the y-axis labeled as hm. The curve starts at hm when ϕ is 0 degrees and decreases to 0 when ϕ is 90 degrees. The curve appears to be an exponential decay. The origin is labeled as O. An arrow points upwards next to hm.
Option 1
Solution
The maximum height for a projectile when the projection angle is measured from the vertical is given by:
h=2g(ucosϕ)2=hmcos2ϕ,
where
hm=2gu2.
Thus, h as a function of ϕ is proportional to cos2ϕ. This function has its maximum value hm at ϕ=0∘ and decreases gradually to 0 at ϕ=90∘.
Core Explanation:
The maximum height is h=hmcos2ϕ. It is maximum at ϕ=0∘ (equal to hm) and zero at ϕ=90∘. Option 1 correctly captures this behavior.