Question
Question: The velocity displacement graph of a particle moving along a straight line is shown in figure. <fig...
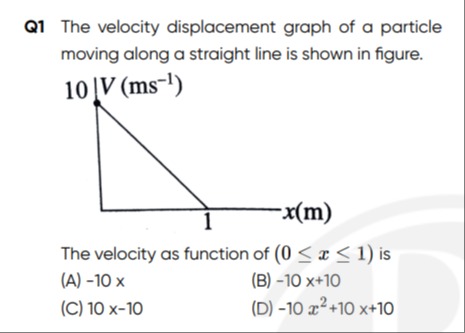
The velocity displacement graph of a particle moving along a straight line is shown in figure.
The velocity as function of (0≤x≤1) is
-10 x
-10 x+10
10 x-10
-10 x2+10x+10
-10 x+10
Solution
The problem asks us to find the velocity (V) as a function of displacement (x) from the given V-x graph for a particle moving along a straight line.
The graph shows a straight line, which can be represented by the linear equation V=mx+c, where m is the slope and c is the V-intercept.
From the graph, we can identify two points:
- At x=0, V=10 ms−1. This is the V-intercept, so c=10.
- At x=1 m, V=0 ms−1.
Now, we calculate the slope (m) using these two points: m=change in xchange in V=x2−x1V2−V1
Let (x1,V1)=(0,10) and (x2,V2)=(1,0). m=1−00−10=1−10=−10 s−1
Substitute the slope (m=−10) and the V-intercept (c=10) into the equation V=mx+c: V=−10x+10
This equation describes the velocity as a function of displacement for 0≤x≤1.