Question
Question: The oscillations represented by curve 1 in the graph are expressed by equations x = A sinωt. The eq...
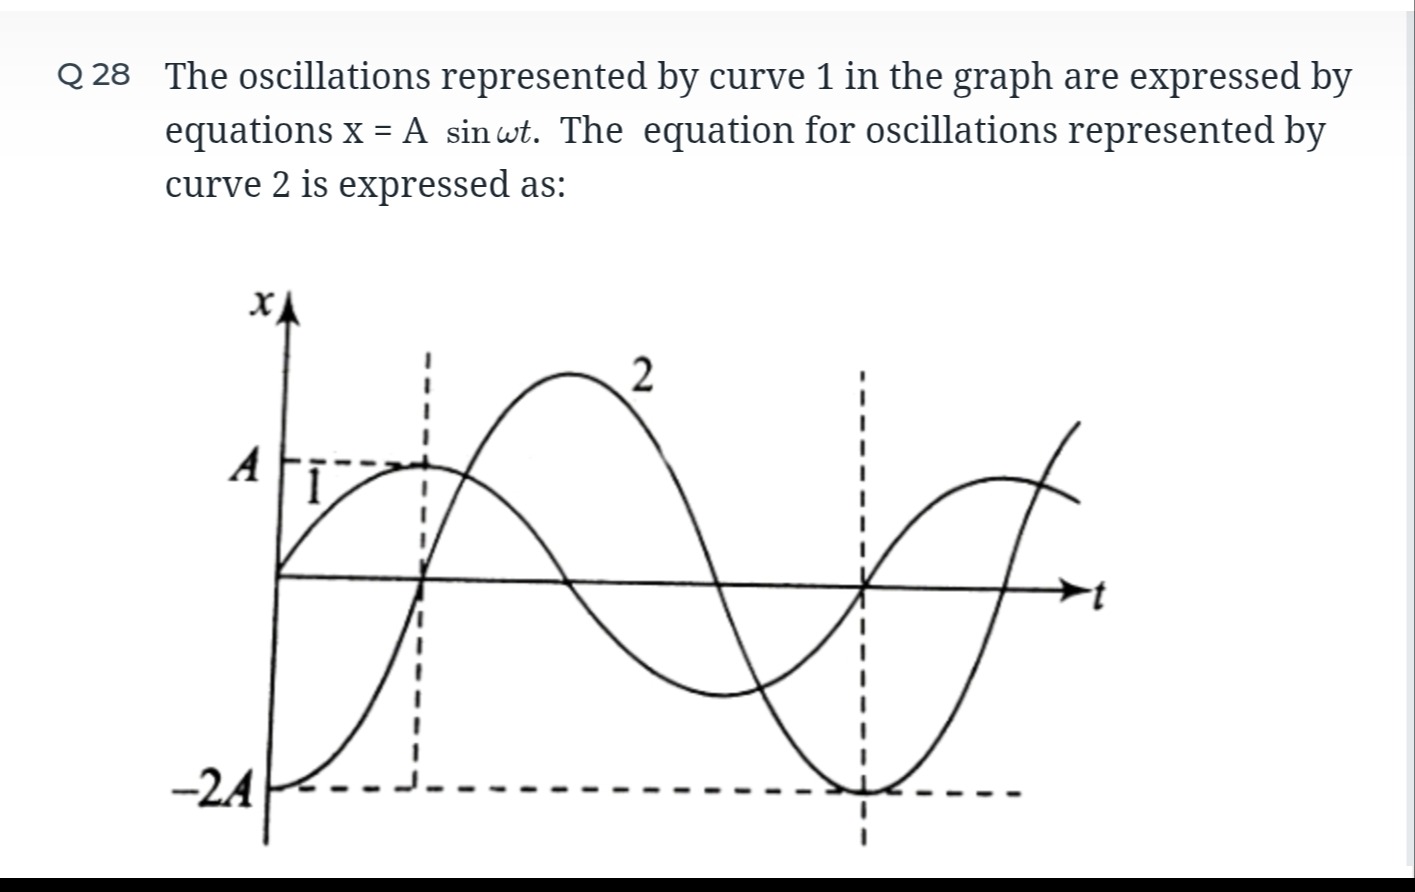
The oscillations represented by curve 1 in the graph are expressed by equations x = A sinωt. The equation for oscillations represented by curve 2 is expressed as:
Answer
x = -2A cos(ωt)
Explanation
Solution
Curve 1 is a sine wave starting from 0 at t=0. Curve 2 has an amplitude of 2A and starts at x = -2A at t=0. Using the form x2(t)=A′cos(ω′t+ϕ), with A′=2A and ω′=ω, we have x2(t)=2Acos(ωt+ϕ). At t=0, x2(0)=−2A, so 2Acos(ϕ)=−2A, which means cos(ϕ)=−1. Thus, ϕ=π. The equation becomes x2(t)=2Acos(ωt+π)=−2Acos(ωt).