Question
Question: Graph shows the x(t) curves for three experiments involving a particular spring-block system oscilla...
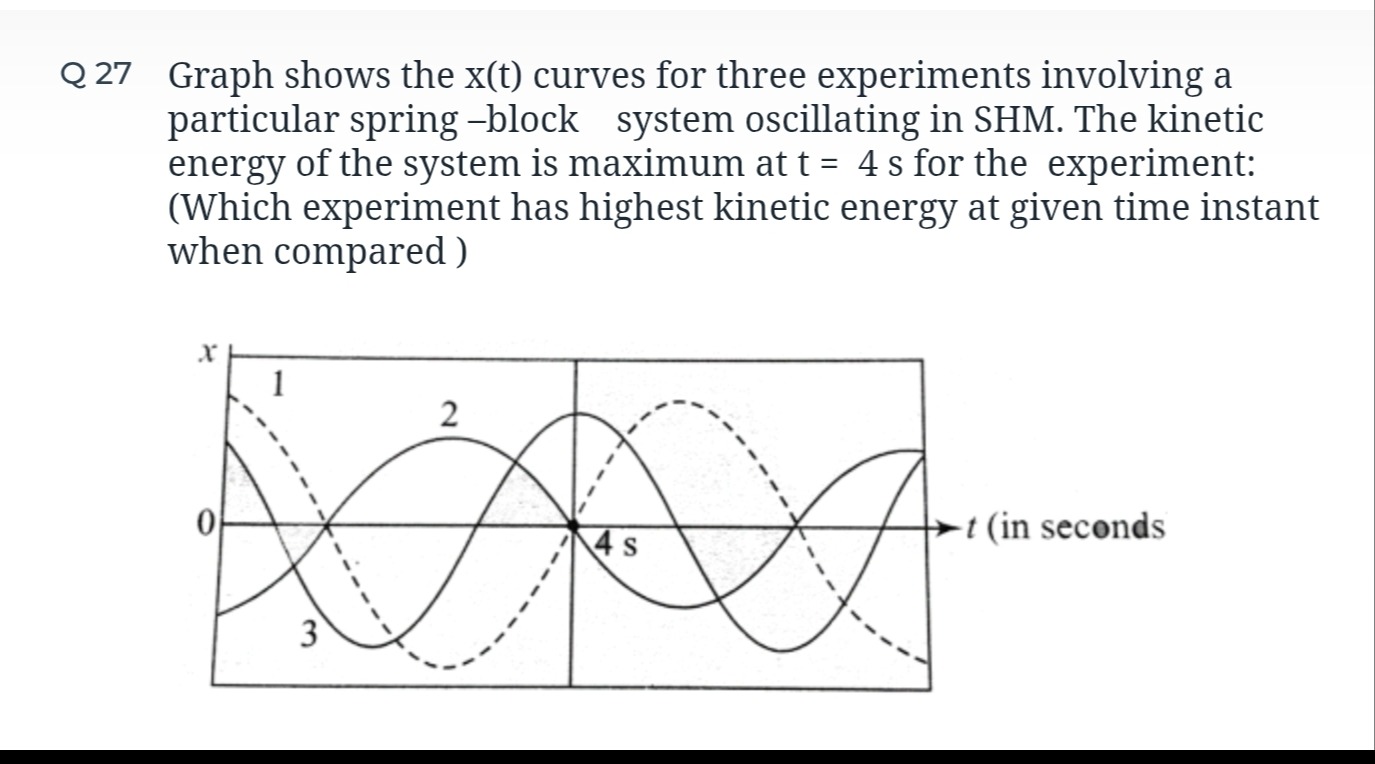
Graph shows the x(t) curves for three experiments involving a particular spring-block system oscillating in SHM. The kinetic energy of the system is maximum at t = 4 s for the experiment: (Which experiment has highest kinetic energy at given time instant when compared )
A
1
B
2
C
3
D
All have same kinetic energy
Answer
1
Explanation
Solution
In SHM, kinetic energy is maximum at the equilibrium position (x=0) and zero at the extreme positions (x=±A). At t=4 s, experiment 1 is at x=0 (equilibrium). Experiments 2 and 3 are at their extreme positions (x=A2 and x=−A3). Therefore, experiment 1 has maximum kinetic energy.