Question
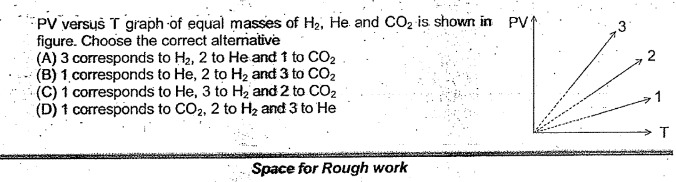
Question: PV versus T graph of equal masses of H₂, He and CO₂ is shown in figure. Choose the correct alternati...
PV versus T graph of equal masses of H₂, He and CO₂ is shown in figure. Choose the correct alternative
A
3 corresponds to H₂, 2 to He and 1 to CO₂
B
1 corresponds to He, 2 to H₂ and 3 to CO₂
C
1 corresponds to He, 3 to H₂ and 2 to CO₂
D
1 corresponds to CO₂, 2 to H₂ and 3 to He
Answer
3 corresponds to H₂, 2 to He and 1 to CO₂
Explanation
Solution
For equal masses of gases, the number of moles n is inversely proportional to the molar mass M, given by n=Mm.
- H₂ has the smallest molar mass (M≈2), so it has the largest number of moles.
- He has an intermediate molar mass (M≈4).
- CO₂ has the largest molar mass (M≈44), so it has the smallest number of moles.
In a PV vs. T graph, the slope is proportional to nR. Therefore, a higher n results in a steeper slope.
- Line 3 (steepest) corresponds to H₂.
- Line 2 (intermediate) corresponds to He.
- Line 1 (shallowest) corresponds to CO₂.