Question
Question: Pressure versus temperature graph of an ideal gas is as shown in figure. Density of the gas at point...
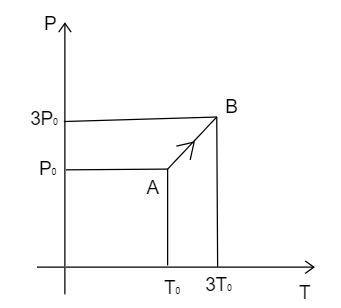
Pressure versus temperature graph of an ideal gas is as shown in figure. Density of the gas at point A is ρ0 . Density at point B will be:
(A) 43ρ0
(B) 23ρ0
(C) 34ρ0
(D) 2ρ0
Solution
Hint Use the formula of the ideal gas equation, substitute the relation between the volume and the density in it. Solving it provides the value of the density. Find the same for the point A and B by substituting the temperature and the pressure at them.
Useful formul
(1) The formula of the ideal gas equation is given by
PV=nRT
Where P is the pressure, V is the volume, n is the number of moles, R is the gas constant and T is the temperature.
(2) The relation between the two volume and the molar mass is given by
Vn=Md
Where d is the density of the gas and M is the molar mass of the gas.
Complete step by step solution
Observe the diagram and analyze the value of the pressure and the temperature in the point A and B .
Let us write the ideal gas equation,
PV=nRT
Bring the volume to the right hand side of the equation, we get
P=VnRT
Substituting the relation (2) in the above equation, we get
P=MdRT
The density of the gas is found as
d=RTPM ------------(1)
Substituting the value of the temperature and the pressure at a point A,
d=RTAPAM
Substituting the values,
ρ0=RT0P0M --------------(2)
Substituting the (1) with the value of the temperature and the pressure at a point B ,
d=RTBPBM
dB=R2T03P0M=23ρ0 ---------------(3)
Thus the option (B) is correct.
Note Ideal gas equation is also known as the equation of the states, because this equation uses the variables in it to determine or explain about the state of the gas that is considered. This is mainly used to interconvert the volume with the molar mass.