Question
Question: Plot the points \[(1,1)\] \[(2, - 2)\] and \[( - 1, - 2)\] on a graph paper and find the area of the...
Plot the points (1,1) (2,−2) and (−1,−2) on a graph paper and find the area of the figure so obtained.
Solution
Hint : First draw the x and y axis. Observe the points, see in which quadrant each of them will lie and plot them accordingly. To find the area of the figure, join the points and observe which shape they form and recall the formula for the area of that particular shape, use it to find the area of the figure obtained.
Complete step-by-step answer :
Given, the points (1,1) (2,−2) and (−1,−2)
Let the points be P(1,1),Q(2,−2) and R(−1,−2) .
To plot these points, first we need to draw x-axis and y-axis.
We observe that there are four quadrants, now we plot the points P, Q and R accordingly.
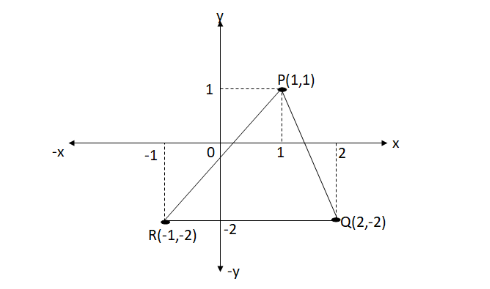
We observe that the figure obtained by joining the points is a triangle
Area of a triangle is given by
⇒A=21×base×height (i)
Here, if we take RQ as the base the height of the triangle will be equal to the perpendicular distance between the point P and line RQ, and from the figure we observe the height is,
⇒H=1+2=3
The base is equal to the length of the line RQ, which can observe from the figure we can observe from the figure as
⇒B=1+2=3
Now, area of the triangle PQR is,
⇒A=21×B×H
Putting the values of B and H, we get