Question
Question: Plot the graph of line \[x{\text{ }} = {\text{ }}5\]....
Plot the graph of line x = 5.
Solution
When we are to plot the graph x=k then the straight line parallel to the y-axis would be there passing through the point x=k . The line would be vertical as the line y=0 that is y-axis is also vertical on the graph.
Complete step by step solution:
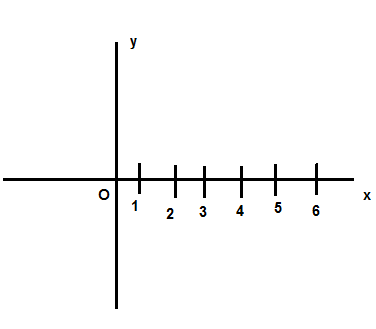
Step 1 Draw a horizontal line first and name its x-axis.
Step 2. then draw a vertical line intersecting the x-axis in the middle and name its y-axis.
Step 3. Name the point of intersection as O. where O represents the origin.
Step 4. Draw the markings from 1 to 5 on the x-axis which will occur on the right-hand side of the origin and make sure the markings would be equidistant to each other.
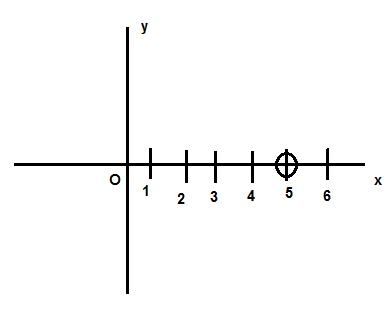
Step 5 . Encircle the point x=5
Step 6. Draw a straight line parallel to y axis passing through the point x=5 that you encircled.
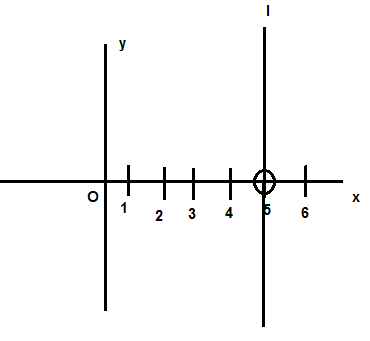
Step 7. Name the line l which is the required graph of x=5
Note:
- We know that the graph basically consists of two axes ; x-axis and y-axis.
- x-axis is the horizontal one whereas the y –axis is the vertical one.
- If we plot the graph x=k , the line would be parallel to the y axis passing through x=k i.e. the vertical line would be there.
- If we have to plot the graph of y=p , the line would be parallel to the x axis passing through the point x=k a horizontal line would be there.
- If we have to plot the graph of line x=y then a straight line passing through the origin would be there. This line is neither horizontal nor vertical.