Question
Question: Plot the graph of \({{\cos }^{-1}}\left( \cos x \right)\) and write its domain and range....
Plot the graph of cos−1(cosx) and write its domain and range.
Solution
Hint: In this question, we will first understand the relation of cosx and cos−1x. Then, observe the graph of cosx, and how they change sign and use it to plot a graph of cos−1(cosx). From the graph, we will find its range and domain.
Complete step-by-step answer:
Firstly, let us understand what is meant by the inverse function of cosine.
Suppose, y=cos−1x.
Then, for each value of x there will exist some value of y. Then, the cosine inverse of this value of y will be x.
For example, 21=cos6π.
Then, cos−121=6π.
Now, cosx is a periodic function with period 2π, which means its values repeat in the same pattern after 2π increases in x. That is, cosx=cos(2π+x).
Since, cosx is periodic with period 2π. Therefore, cos−1(cosx) is also period with period 2π.
Also, the domain here is set of those values of x for which cos−1(cosx) is defined. And, range is the set of values where cos−1(cosx) lies.
Now, for all real values of x, cosxlies between -1 and 1. And, between -1 and 1, the inverse function of cosine is defined. Therefore, cos−1(cosx) is defined for all real values of x. Hence, the domain of cos−1(cosx) is (−∞,∞) .
We know, graph of y=cosx is:
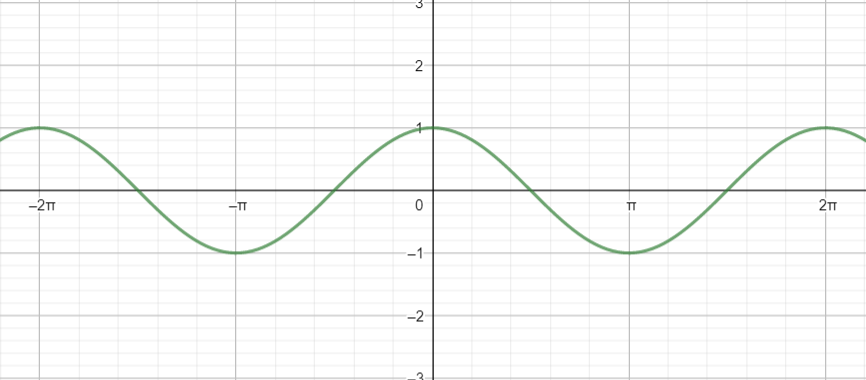
We see that, in the interval [−π,π], for two different values of x, we have the same value of y.
Also, from definition of cosine inverse, in this graph, we get,
cos−1y=x
If we substitute y=cosx here, we get,
cos−1(cosx)=x
Now, in graph of cos−1(cosx), we have,
y=cos−1(cosx)
⇒y=x
But, in interval [−π,π], for two different values of x, we have the same value of y.
Let those two different values be represented by y1,y2.
Now, as x increases from −π to 0, cosx increases from -1 to 1, and hence, cos−1(cosx) decreases from π to 0. Therefore, here we will have, y1=−x.
And as x increases from 0 to π, cosx decreases from 1 to -1, and hence, cos−1(cosx) increases from 0 toπ. Therefore, here we will have, y2=x.
Also, from −π to π, length of interval is 2π and cos−1(cosx) periodic with period 2π. Therefore, the rest of the graph will repeat the same as in the interval [−π,π].
Hence, the graph of cos−1(cosx) is given by:
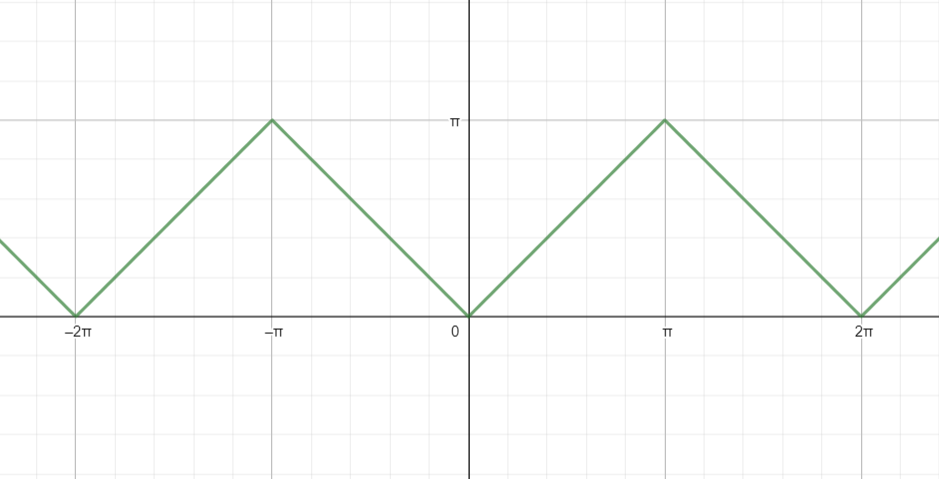
Here, values of cos−1(cosx) lies between 0 to π.
Hence for the graph of cos−1(cosx) plotted above, the domain is (−∞,∞) and the range is [0,π].
Note: While plotting the graph, keep in mind that for two different values of x, cos−1(cosx) will have the same value in interval of length 2π. So, looking at y=x, do not directly plot a graph of an infinite straight line.