Question
Question: Plot the graph for the function\[f\left( x \right) = {4^x}\]....
Plot the graph for the functionf(x)=4x.
Solution
For plotting a graph we need different x values as well as their corresponding y values. Such that to solve this question we need to find the x intercept, y intercept and some intermediate values. Also the x-intercept and y-intercept can be found by substituting y=0 and x=0 respectively. After finding these values we just need to plot them on the XY plane.
Complete step by step solution:
Given
f(x)=4x......................(i)
Now we know, x intercept is the point where the graph touches the X axis such that y=0.
So substitute y=0 in (i):
⇒y=f(x)=4x ⇒0=4x ⇒4x=0.................(ii)
On observing (ii) we can say that (ii) is mathematically wrong.
Therefore it implies for f(x)=4xthere would be no x intercept and alsof(x)≻0.
Now for finding the y intercept we have to put x=0 since y intercept is the point where the graph touches the Y axis.
So substitute x=0 in (i):
⇒y=f(x)=4x ⇒y=40 ⇒y=1................(iii)
Therefore from (iii) we can write :
y intercept=(0,1)
Now let’s find some intermediate points:
For x=1:
⇒y=f(x)=4x ⇒y=41=4
∴(1,4)isapoint.
For x=2
⇒y=f(x)=4x ⇒y=42=16 ∴(2,16)isapoint.
Now take negative values of x:
For x=-1
⇒y=f(x)=4x ⇒y=4−1=41=0.25 ∴(−1,0.25)isapoint.
For x=-2
⇒y=f(x)=4x ⇒y=4−2=421=161=0.06 ∴(−2,0.06)isapoint.
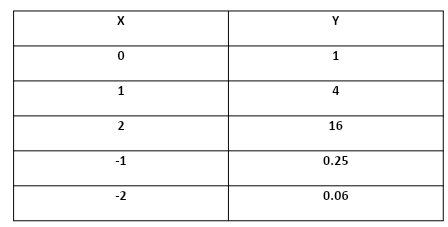
Now all these values which we have got from above is to be plotted in a XY plane.
Plotting the points
(0,1),(1,4),(2,16),(−1,0.25),(−2,0.06)
We get the following graph:
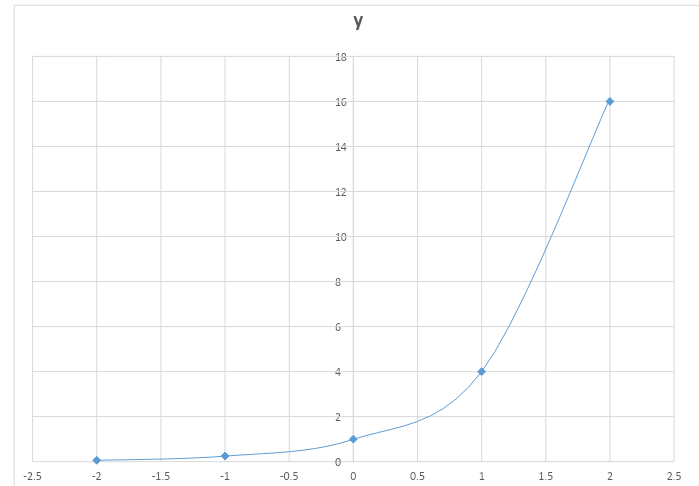
The above graph shows the plot of the functionf(x)=4x.
Note: While approaching a similar graphical question one should find as many points as possible from the given conditions and common knowledge. Also one must be careful while doing the solution. Also while plotting the graph one must choose appropriate scale considering the values that should be plotted.