Question
Question: Plot the graph and list the amplitude, period, phase shift for the given equation, y=−sin(πx+1) −2...
Plot the graph and list the amplitude, period, phase shift for the given equation,
y=−sin(πx+1) −2?
Solution
To find the amplitude, time period and the phase shift, compare the given equation to the standard “sine” wave equation. After comparing, put the values in the respective formulas to get the final answers. While plotting the graphs all these data that you have solved will help in easier plotting.
Complete step by step solution:
The standard sine equation looks like,
Y = A sin (Bx + C) +D
Where,
Amplitude = |A|
The period, τ =2π|B|
The phase shift, ϕ =−BC
Comparing the given question y=−sin(πx+1) −2 to a standard sine equation,
we have,
Amplitude = |A| = |-1| = 1
The period, τ =∣B∣2π = π2π= 2
The phase shift, ϕ =−BC= −π1
Now, we can draw the graph that would look like the following:
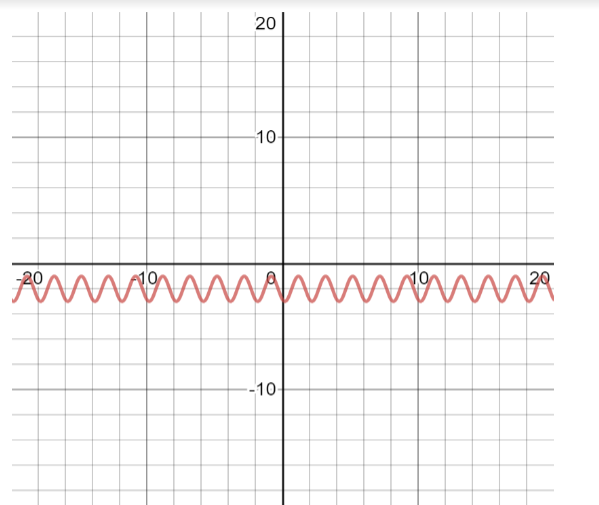
You can see that the negative sign in the beginning of the expression on the right-hand side implies
that the sinusoidal curve is the negative part of the y – axis. The negative constant of “-2” in the RHS implies that the curve shifts further below by 2 units.
Note: It is advisable to always find out the amplitude and time period first, before plotting the graph. This helps in plotting the graph with more clarity. Sinusoidal curves also have time periods, which decide the width of each crest and trough of the graph.