Question
Question: Plot the following graphs: 1\. \(P\) vs \(V\) 2\. \(P\) vs \(\dfrac{1}{V}\) 3\. \(PV\) vs \(P\...
Plot the following graphs:
1. P vs V
2. P vs V1
3. PV vs P
Solution
Boyle’s law helps in understanding the behaviour of gases when the temperature is constant. It states that the pressure of the gas is inversely proportional to its volume when the temperature is constant.
P∝V P=Vk PV=kWhere V is the volume, P is the pressure and k is the constant value
Complete step by step answer:
1. P vs V:
As we know that pressure and volume of a gas is inversely proportional (According to Boyle’s law), Hence, pressure will increase as the volume decreases. The graph is as follows:
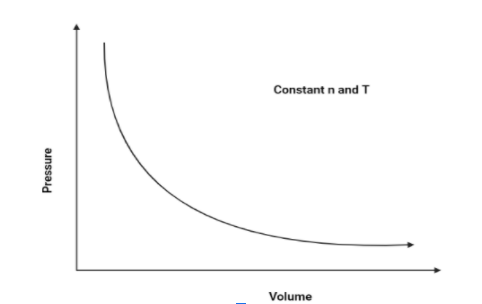
Hence, The graph of pressure vs volume will be a rectangular hyperbola.
2. P vs V1:
As we know that P and V1 is directly proportional (According to boyle’s law), Hence, pressure will increase as the volume increases.The graph is as follows:
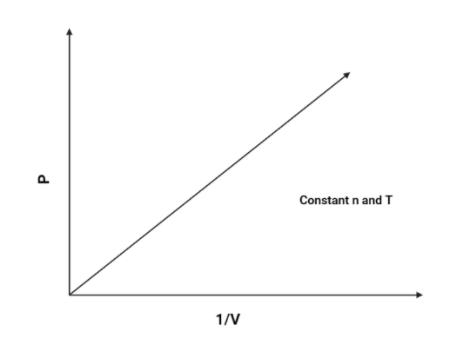
Hence, The graph of P vs V1 will be a linear graph.
3. PV vs P:
As we know that PV=k, (According to Boyle's law). Hence the PV axis will remain constant for all values of P. The graph is as follows:
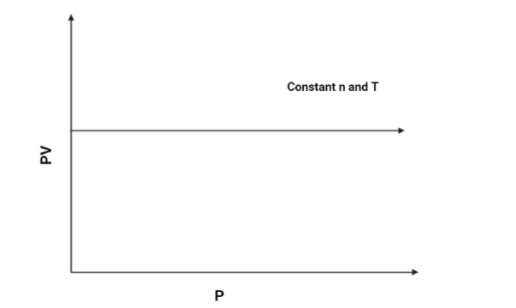
Hence, The graph of PV vs P will be a constant graph.
Note: Boyle’s law has many real life applications. For example, It’s being used in medical field to check the breathing system in the human body. It helps in explaining how the air pressure within our lungs increases or decreases with respect to the volume of our lungs. This results in the difference in air pressure within our lungs and the environmental air.