Question
Question: Plot P versus \(\dfrac{1}{V}\) at different temperatures....
Plot P versus V1 at different temperatures.
Solution
We know Boyle’s Law:
According to Boyle's law, as the pressure decreases the volume increases thus, the bubbles at the bottom of a glass of a soft drink get larger when it rises to the surface because when the bubbles rise, the pressure inside the bubble starts to get reduced and the volume (size) of the bubble increases.
At constant temperature, the pressure and the volume of the gas are inversely related.
PV = K
Where P is the pressure of the gas at a constant temperature.
V is the volume of the gas at a constant temperature.
k is the constant.
Complete step by step answer:
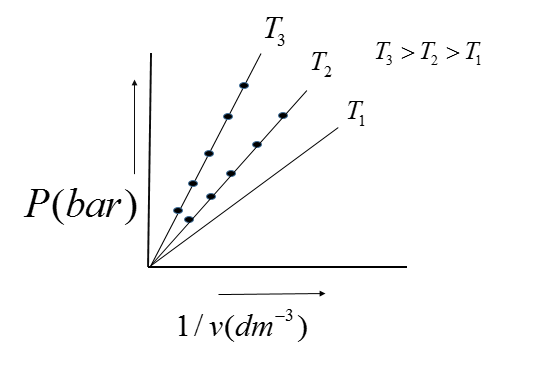
The graph is a straight line through the origin, verifying that the pressure is proportional to V1 verifying Boyle's Law. Also, all values of pressure and volume are the same.
P∝ V1
p=kV1
Therefore, when different values of pressure are plotted against the reciprocals of the respective V1 volume. This graph justifies Boyle's law because the straight line is obtained which passes through the origin.
So, the correct answer is Option D.
Note: We need to know that the Boyles' law explains the reason why the bubble at the bottom of a glass of a soft drink gets larger when it rises to the surface and why the bag of potato chips on a plane ride appeared to be inflated when taken out, We need to know that the bag of potato chips on a plane ride appears to be inflated when taken out because according to Boyle's law whenever the pressure of a gaseous system decreases its volume increases at a constant temperature. At the higher height, the pressure is reduced so the gas inside the bag becomes inflated.