Question
Question: Plot a graph showing the variation of current \( I \) versus resistance \( R \) , connected to a cel...
Plot a graph showing the variation of current I versus resistance R , connected to a cell of emf E and internal resistance r .
Solution
To solve this question, we need to draw the circuit diagram according to the given information. Then using the Ohm’s law we can find out the expression for the current in the circuit in terms of the external resistance. From there we can predict the shape of the graph.
Complete step-by-step solution
According to the information given in the question, a cell of emf E and internal resistance r is connected across a variable external resistance R . So we can represent this information by the circuit diagram shown below.
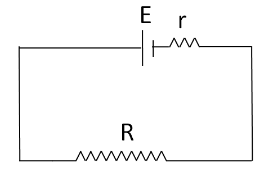
The internal resistance and the external resistance are connected in series combination with each other. So the net resistance in the circuit is
RN=R+r.......................(1)
According to the question a current of I flows in the circuit. Therefore from the Ohm’s law we can write
E=IRN
From (1)
E=I(R+r)
⇒I=R+rE .......................(2)
This is the required equation of the current I in the form of the external resistance R .
Now, we substitute R=0 in (2) to get
I(0)=0+rE
⇒I(0)=rE
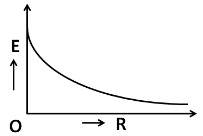
So the graph of this graph must pass through the y axis.
Now, we take the limit r→∞ at both sides in (2) to get
R→∞limI=R→∞lim(R+rE)
We know that x→∞lim(x+k1)=0 . Therefore we have
R→∞limI=0
So the graph must approach the x axis, as the value of the external resistance is increased infinitely. Hence, the graph of current I versus resistance R , is shown in the figure below.
Note
Do not try to obtain the plot by using transformations of the graph. Although we can obtain the plot by that method also, that would take much time and also chances of mistakes are huge. So after getting the equation, always guess the plot by substituting the end point values and taking the limits.