Question
Question: Plot a graph for the equation \[y = - {x^2} + 4x - 1\]....
Plot a graph for the equation y=−x2+4x−1.
Solution
Here we will first find the intercept and the vertex of the equation. We will put the different values of x intercept to get the y intercept. We will then put values of y intercept to get the x intercept. Then we will find the vertex of the graph using the Axis of symmetry formula. Finally, we will plot the graph using the intercept of the vertex.
Complete step-by-step answer:
The equation whose graph we have to form is
y=−x2+4x−1…….(1)
First, we will find the y and x intercept of the graph.
So let us substitute x=0in equation (1), we get
y=0+4×0−1 ⇒y=−1
So we get one point as (0,−1).
Now, we will substitute y=0 in equation (1), we get
0=−x2+4x−1
The above equation is a quadratic equation.
On comparing the above equation to the general form of quadratic formula x=ax2+bx+c, we get
a=−1, b=4 and c=−1
Substituting these value in the formula x=2a−b±b2−4ac, we get
x=−1×2−(4)±42−4(−1)(−1)
Simplifying the expression, we get
⇒x=−2−(4)±16−4
Subtracting the terms, we get
⇒x=−2−4±12
Taking 2 common from numerator and denominator, we get
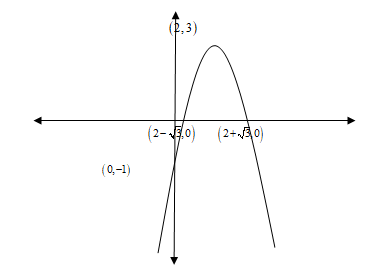
\Rightarrow x = \dfrac{{ - 2 \pm \sqrt 3 }}{{ - 1}}$$$$$$ \Rightarrow x = - \left( { - 2 \pm \sqrt 3 } \right) = \left( {2 \pm \sqrt 3 } \right)Sowegetpointsas\left( {2 - \sqrt 3 ,0} \right)and\left( {2 + \sqrt 3 ,0} \right).Nowwewillfindtheaxisofsymmetry.Axisofsymmetry = - \dfrac{b}{{2a}}Substitutingb = 4anda = - 1intheaboveequation,weget \Rightarrow Axisofsymmetry = - \dfrac{4}{{2 \times \left( { - 1} \right)}} = 2Nowwewillfindthevertex.WewillusetheformulaVertex = (Axisofsymmetry,f(Axisofsymmetry)),where,f\left( x \right) = - {x^2} + 4x - 1.Substitutingx = 2intheaboveequation,weget\begin{array}{l}f\left( 2 \right) = - {2^2} + 4 \times 2 - 1\\ \Rightarrow f\left( 2 \right) = 3\end{array}Sovertex = \left( {2,3} \right)Asthevalueofaisnegativethereforeparabolashouldopendown.So,wegetourpointsas\left( {2 - \sqrt 3 ,0} \right)(2+3,0)\left( {0, - 1} \right)andourvertexas\left( {2,3} \right)$$.
Now we will plot the graph as follows:
Note: We know that to plot a graph we should have at least three to four points so that we can connect them to form the graph. Finding the vertex is an important step that can’t be skipped as we should know at what point our graph is bending. We could put two values of x in the equation and get the two points from there also that will be a simple method to do.