Question
Question: Plot a graph between potential difference V and current I through a conductor....
Plot a graph between potential difference V and current I through a conductor.
Solution
Hint: To plot the graph between voltage and current I for an ohmic conductor we need to know the ohm’s law according to which the current through a conductor between two points is directly proportional to the voltage across the two points.
Complete step by step answer:
According to ohm’s law the graph between current and potential difference is linear. The voltage is plotted on the x-axis and the current is plotted on the y-axis. This plot is also known as the V-I characteristics. The slope of a V-I graph gives the resistance of the conductor.
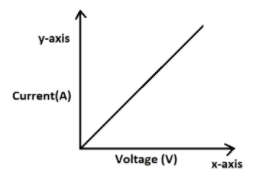
From this graph the value of resistance can be determined by taking any value of voltage and its corresponding current value. According to the Ohm’s Law:
R=IV
Then there is another type of conductors that are called the non- ohmic conductors. As the name suggests they do not obey ohm’s law and therefore the curve between Voltage and current is also non- linear. The graphs of non ohmic conductors can be shown as:
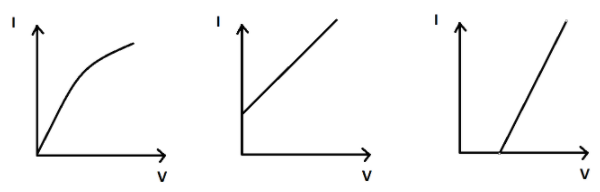
Most resistors are ohmic at their designed temperature range and obey ohm’s law. A lot of semiconductors and bulb filaments are non- ohmic conductors.
Note: Students must remember that the slope of a V-I graph gives the resistance of the conductor and its SI units are ohm. The ohm’s law is obeyed by a conductor only if the physical conditions such as temperature, density, etc remain unchanged.