Question
Question: Photoelectron emission is observed for three different metals A, B, and C. The kinetic energy of the...
Photoelectron emission is observed for three different metals A, B, and C. The kinetic energy of the fastest photoelectrons versus frequency V is plotted for each metal. Which of the following show the phenomenon correctly?
(A) 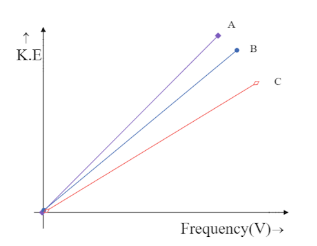
(B) 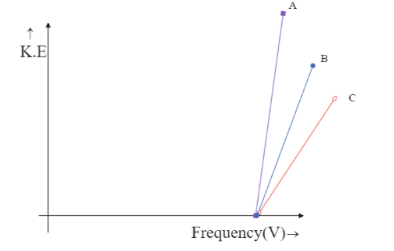
(C) 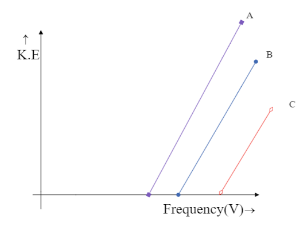
(D) 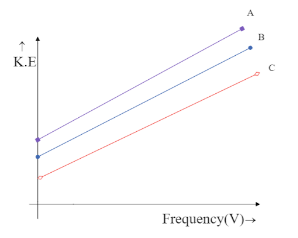
Solution
The maximum kinetic energy of emitted photoelectrons is given by Kmax=λhc−λ0hc .Also, Frequency is inversely proportional to Wavelength of the photoelectrons thus emitted, V∝λ1 .
Formulas Used: We will be using the formula Kmax=λhc−λ0hc where Kmax is the maximum kinetic energy of photoelectrons, λ is the wavelength of the excited photoelectrons, λ0 is their threshold frequency, c is the speed of light and h is the Planck’s constant whose value is h=6.26×10⁻³⁴Js . We will also be using V=λc which is the relation between Frequency (V) and wavelength (λ) .
Complete Step by Step solution
Photoelectric effect of light can only be explained by considering light as a particle instead of a wave. These particles of light are called photons. Energy held by each photon can be given by E=λhc which can also be written as E=hV , since V=λc . Thus, the light of different frequencies carries electrons of different energies.
Now consider light being incident on 3 different metals A, B, C. Each metal has a different frequency and hence photons that are emitted at different energies. Thus, the energies of photons emitted from each metal can be written as,
EA=hVA
EB=hVB
Also, the kinetic energy of the photons emitted from these metals can be written as K=hV−hV0 . This is the equation for each line plotted on the K-V graph. From the equation we can see that the equation resembles the Y-intercept.
Comparing the equation of a straight line with gradient m and intercept c on Y-axis, that is, y=mx+c and assigning corresponding terms from the equation. We can see that
y=K , mx=hV , c=−hV0
The intercept on Y-axis c=−hV0 is negative and hence the line is supposed to meet the Y-axis at the negative part of the axis. This is only possible in the graph,
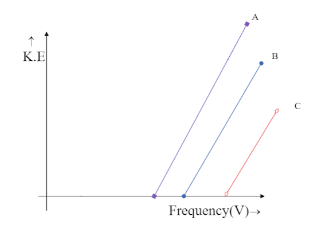
Hence the correct answer is option C.
Note
We can see that both the graphs, in option B and option C meet the Y-axis only at the negative side but option B is being ruled out. This is because in option B the graph depicts all the three metals to have the same frequency, which is impossible unless they are the same metal. Hence the answer could only be option C.